Comparative Study
. 2005 Oct 4;102(40):14434-9.
doi: 10.1073/pnas.0501956102. Epub 2005 Sep 26.

Long-term potentiation of exogenous glutamate responses at single dendritic spines

Affiliations
Comparative Study

Long-term potentiation of exogenous glutamate responses at single dendritic spines

Ashish A Bagal et al. Proc Natl Acad Sci U S A. .

Abstract

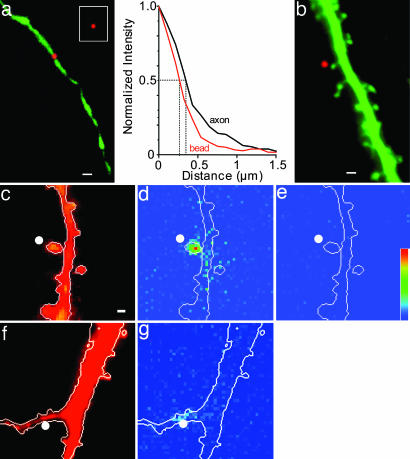
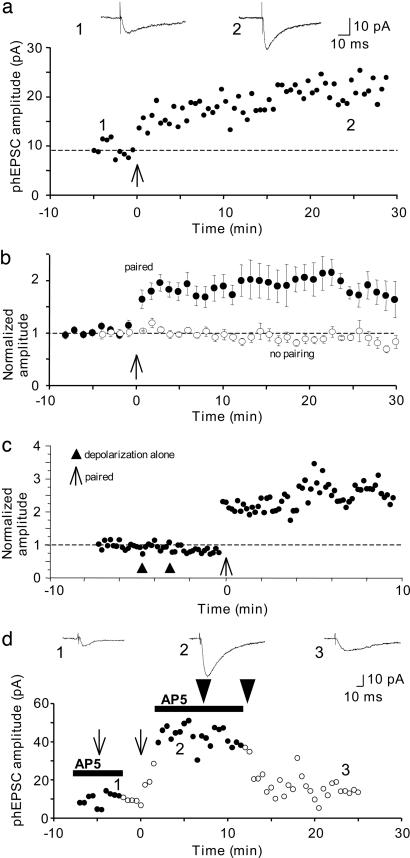
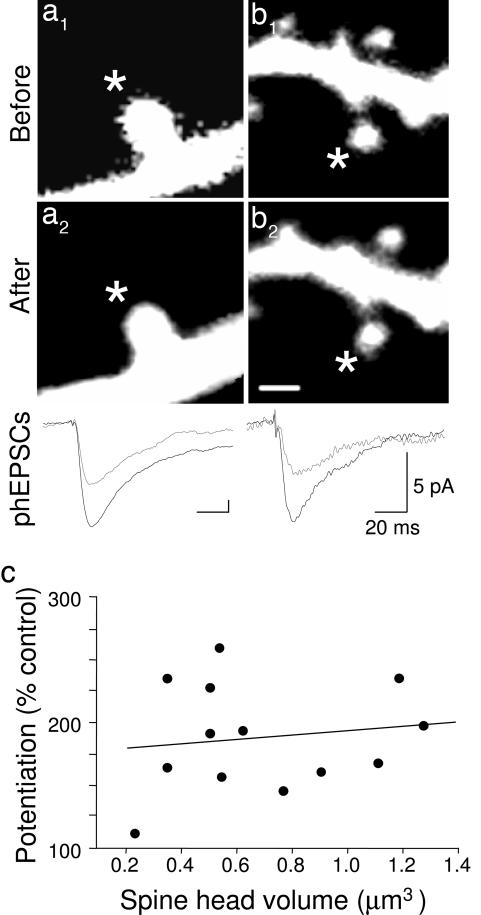
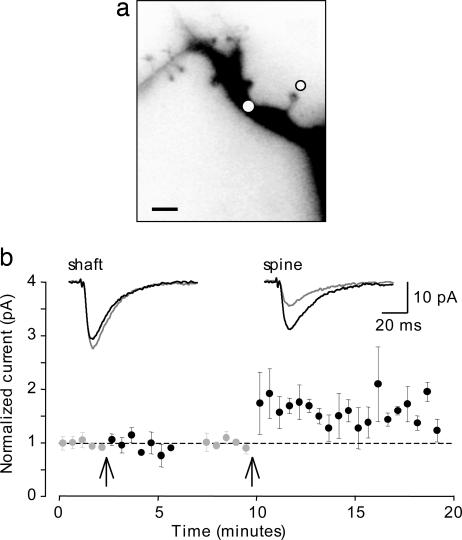
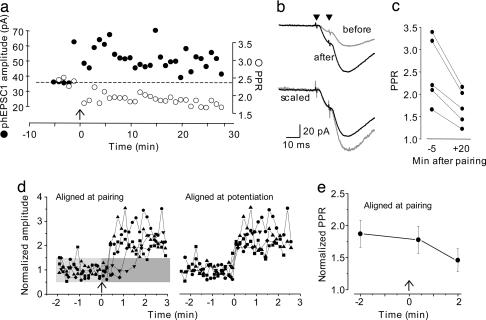
Long-term increases in the strength of excitatory transmission at Schaffer collateral-CA1 cell synapses of the hippocampus require the insertion of new alpha-amino-3-hydroxy-5-methyl-4-isoxazolepropionate receptors (AMPARs) into the synapse, but the kinetics of this process are not well established. Using microphotolysis of caged glutamate to activate receptors at single dendritic spines in hippocampal CA1 cells, we report the long-lasting potentiation of AMPAR-mediated currents with only a single pairing of photoreleased glutamate and brief postsynaptic depolarization. This potentiation was N-methyl-d-aspartate receptor (NMDAR)-dependent and was reversed with low-frequency photostimulation in an NMDAR-dependent manner, suggesting that it is mediated by the same mechanism(s) as conventional synaptic long-term potentiation. Potentiation of photolytic responses developed rapidly in a stepwise manner after a brief and variable delay (<60 s) at spines, but could not be induced at extrasynaptic sites on the dendritic shaft. Potentiation was accompanied by a concomitant decrease in postsynaptic, polyamine-dependent paired-pulse facilitation of the photolytic currents, indicating that a change in the subunit composition of the AMPARs underlying the response contributed to the potentiation. These changes are consistent with an increase in the proportion of GluR2-containing AMPARs in the spine head. These results demonstrate that activation of postsynaptic glutamate receptors by glutamate is not only necessary, but sufficient, for the induction of NMDAR-dependent long-term potentiation and reveal additional aspects of its expression.


Figures

Fig. 1.
Fig. 1.
Stimulation of single dendritic spines with photolysis of caged glutamate. (a) The spatial resolution of the UV spot was determined by imaging GFP in the axon of a CA1 pyramidal cell in response to wide-field excitation (green channel) or excitation by a UV spot (red channel). (Inset) Wide-field excitation of a 0.2-μm-diameter fluorescent polystyrene micro-sphere (Molecular Probes) embedded 20 μm deep in a hippocampal culture. Plots of the normalized, background-subtracted fluorescence intensity profiles for the bead and the UV excited GFP spot in a, measured along the long axis of the axon, are shown. The widths of the intensity profiles at half maximal amplitude were 0.6 and 0.8 μm, respectively. (b) The UV spot (imaged in red channel) was targeted to a point just distal to the head of an individual dendritic spine, which was visualized with wide-field excitation of intracellular Alexa 568 (green channel). (c and f) Wide-field fluorescence image of a dendritic segment loaded with Alexa 568. The white spot marks the site of UV photolysis in c-g. (d) Image of the maximal change in fluo-4 fluorescence after the photolysis of caged glutamate by using a 1-ms UV pulse (Mg2+-free saline plus 6,7-dinitroquinoxaline-2,3-dione). Fluo-4 emission increased in the targeted dendritic spine, but not in adjacent spines or the underlying dendritic shaft. (e) Block of NMDARs with AP5 eliminated glutamate-induced fluo-4 emission. ΔF scale = 0-100 a.u. (also applies to d and g). (g) Image of the maximal change in fluo-4 fluorescence after the photolysis of caged glutamate by using a 1-ms UV pulse (Mg2+-free saline plus 6,7-dinitroquinoxaline-2,3-dione) directed to the dendritic shaft in f. (Scale bars: 1 μm.)
Fig. 2.
Fig. 2.
Potentiation of photolysis-induced responses. (a) The amplitude of single spine phEPSCs is plotted as a function of time. After 5 min of baseline recording, a single 200-ms depolarizing voltage step to -10 mV was paired with one phEPSC (time indicated by arrow), resulting in an increase in response amplitude. Averaged single spine phEPSCs from indicated times before and after the pairing are shown at the top. Vertical deflections indicate time of laser pulse. (b) Shown are pooled data demonstrating that phEPSC amplitude is stable when not paired with a depolarizing current pulse (n = 5 cells; open symbols), and pooled data showing the mean potentiation (±SEM) of phEPSCs in 13 cells (filled symbols). (c) A depolarizing voltage step to -10 mV that is not paired with photolysis (delivered at the time indicated by ▴) did not induce phEPSC potentiation, whereas an identical step combined with uncaging of glutamate did induce potentiation at the same spine in the same cell (arrow). (d) Block of NMDARs with AP5 (black line) prevented potentiation of phEPSCs reversibly (thin arrows) and also reversibly prevented depotentiation of responses produced by 100 UV pulses delivered at 10 Hz (thick arrows). Averaged phEPSCs from the indicated times are shown at the top.
Fig. 3.
Fig. 3.
Both large and small spines express LTP. (a and b) Images of stimulated large (a) and small (b) dendritic spines (indicated by asterisks) are shown 1 min before (a1 and b1) and 5 min after the pairing procedure (a2 and b2), i.e., the peak of swelling reported by Matsuzaki et al. (7). (Scale bar: 1 μm.) The volume of the spine in a was 1.27 μm3 before and 1.13 μm3 after LTP induction, whereas the spine in b was 0.35 μm3 before and 0.36 μm3 after LTP. Corresponding phEPSCs before (gray) and 5 min after pairing (black) are shown superimposed at the bottom. Calibration bars apply to all phEPSCs. (c) Plot of phEPSC potentiation, measured 5 min after pairing, as a function of the volume of the head of the stimulated spine. We observed no correlation (r = 0.14) between early LTP and the volume of the spine head over a large range (cf. ref. 7). We conclude that changes in spine volume need not accompany LTP.
Fig. 4.
Fig. 4.
Potentiation of phEPSCs at the spine head but not at the dendritic shaft. (a) Negative image of an Alexa 568-filled dendritic segment showing two sites of photolysis; on the dendritic shaft (white spot) and at an adjacent spine head (black circle). (Scale bar: 2 μm.) (b) Pooled data (n = 3 cells) showing mean phEPSC amplitude (±SEM) for responses elicited from the dendritic shaft and after repositioning the UV spot to the spine head. Pairing a phEPSC with a single depolarizing pulse (at times indicated by arrow) failed to potentiate shaft responses, but did potentiate spine responses. In these cells, phEPSCs at the shaft and spine head had amplitudes of 13 ± 5 and 7 ± 2 pA, respectively, and showed comparable kinetics. Representative shaft (Left Inset) and spine (Right Inset) phEPSCs before (gray) and after pairing (black) for the cell illustrated in a are shown.
Fig. 5.
Fig. 5.
Potentiation of phEPSCs is accompanied by a decrease in postsynaptic paired-pulse facilitation. (a) At the time indicated by the arrow, potentiation of phEPSC amplitude (•) occurred simultaneously with a decrease in the PPR of the phEPSCs (○) elicited with a pair of pulses delivered 10 ms apart. (b) Representative averaged traces elicited with pairs of UV pulses (indicated by black triangles) from the experiment in a before (gray) and 20 min after (black) pairing are shown superimposed (upper traces). The decrease in the relative amplitude of the second response is readily apparent in the lower pair of traces, in which the responses have been scaled so that the amplitudes of the first phEPSCs in the pair are the same. (c) Summary plot indicating the decreased PPR before and 20-25 min after induction of potentiation. (d) Potentiation of phEPSCs occurred in a delayed, stepwise manner, as indicated by the graph (Left), in which the amplitudes of phEPSCs in five cells are plotted superimposed as a function of time relative to the pairing pulse (indicated by arrow). The gray box indicates 2 SDs from the control amplitude. (Right) The stepwise nature of the amplitude transition is more readily apparent after the data are aligned by the time of the transition and replotted. (e) Although less well resolved than the change in phEPSC amplitude, the change in PPR also occurred in a delayed stepwise manner, as shown in this plot of mean PPR (±SEM) 2 min before, 25 s after, and 2 min after the pairing pulse (indicated by arrow) for the same five cells as in d. The control PPR was significantly different from the PPR at 2 min after pairing (P < 0.05), but not the PPR immediately after pairing (ANOVA, Scheffé's test).

Similar articles

Cited by

References

    1. Malenka, R. C. & Nicoll, R. A. (1999) Science 285, 1870-1874. - PubMed
    1. Morris, R. G., Moser, E. I., Riedel, G., Martin, S. J., Sandin, J., Day, M. & O'Carroll, C. (2003) Philos. Trans. R. Soc. London B 358, 773-786. - PMC - PubMed
    1. Kandler, K., Katz, L. C. & Kauer, J. A. (1998) Nat. Neurosci. 1, 119-123. - PubMed
    1. Eder, M., Zieglgänsberger, W. & Dodt, H. U. (2002) J. Neurosci. 22, 7558-7568. - PMC - PubMed
    1. Schulz, P. E., Cook, E. P. & Johnston, D. (1994) J. Neurosci. 14, 5325-5337. - PMC - PubMed

Publication types