. 2005 Oct;126(4):339-52.
doi: 10.1085/jgp.200509285.

Endogenous protease activation of ENaC: effect of serine protease inhibition on ENaC single channel properties

Affiliations

Endogenous protease activation of ENaC: effect of serine protease inhibition on ENaC single channel properties

Adedotun Adebamiro et al. J Gen Physiol. 2005 Oct.

Abstract

Endogenous serine proteases have been reported to control the reabsorption of Na(+) by kidney- and lung-derived epithelial cells via stimulation of electrogenic Na(+) transport mediated by the epithelial Na(+) channel (ENaC). In this study we investigated the effects of aprotinin on ENaC single channel properties using transepithelial fluctuation analysis in the amphibian kidney epithelium, A6. Aprotinin caused a time- and concentration-dependent inhibition (84 +/- 10.5%) in the amiloride-sensitive sodium transport (I(Na)) with a time constant of 18 min and half maximal inhibition constant of 1 microM. Analysis of amiloride analogue blocker-induced fluctuations in I(Na) showed linear rate-concentration plots with identical blocker on and off rates in control and aprotinin-inhibited conditions. Verification of open-block kinetics allowed for the use of a pulse protocol method (Helman, S.I., X. Liu, K. Baldwin, B.L. Blazer-Yost, and W.J. Els. 1998. Am. J. Physiol. 274:C947-C957) to study the same cells under different conditions as well as the reversibility of the aprotinin effect on single channel properties. Aprotinin caused reversible changes in all three single channel properties but only the change in the number of open channels was consistent with the inhibition of I(Na). A 50% decrease in I(Na) was accompanied by 50% increases in the single channel current and open probability but an 80% decrease in the number of open channels. Washout of aprotinin led to a time-dependent restoration of I(Na) as well as the single channel properties to the control, pre-aprotinin, values. We conclude that protease regulation of I(Na) is mediated by changes in the number of open channels in the apical membrane. The increase in the single channel current caused by protease inhibition can be explained by a hyperpolarization of the apical membrane potential as active Na(+) channels are retrieved. The paradoxical increase in channel open probability caused by protease inhibition will require further investigation but does suggest a potential compensatory regulatory mechanism to maintain I(Na) at some minimal threshold value.


Figures

Figure 1.
Figure 1.
Effect of apically administered aprotinin on amiloride-sensitive ISC in A6 cell monolayers. A6 cells in Ussing chambers with symmetrical bath solutions continuously gassed with air were voltage clamped at 0 mV and ISC monitored. After a 25–30-min equilibration period (A) PBS or (B) aprotinin 10 μM was added to the apical bath. ISC was monitored for 50 min then 10 μM amiloride was added to the apical bath to determine INa. The current deflections are responses to 4 mV bipolar pulses used to measure transepithelial resistance. (C) The mean values of ISC before (shaded bar), 50 min after addition of PBS/aprotinin (hatched bars), and following addition of amiloride (filled bars) indicate substantial decrease of ISC by aprotinin. The error bars are ± SEM. Significant decrease was found in comparing ISC values before and 50 min following addition of aprotinin but not PBS with n = 12 and 14 filters for PBS and aprotinin experiments, respectively (*, P < 0.01).
Figure 2.
Figure 2.
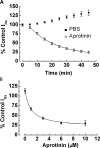
Time and concentration dependence of the effect of aprotinin on INa. (A) INa after apical administration of PBS (filled squares) or 10 μM aprotinin (open circles) was plotted as a percentage of INa before administration (control) using data recorded at 5-min intervals. The data points plotted represent the mean values of 12 filters each for PBS and aprotinin addition with error bars corresponding to ± SEM. A small time-dependent increase in INa could be seen with PBS addition but was not consistently observed in all the filters measured. The solid line through the aprotinin data points represents a fit to an exponential decay % control INa = a*exp(−t/τ) + b ignoring the time = 0 data point. The constants a and b represent the percentage of INa sensitive and insensitive to 10 μM aprotinin, respectively. The mean control INa for the set of 24 filters used in this experiment was 8.2 ± 0.36 μA/cm2. (B) The % control INa was measured at 50 min after adding the indicated concentration 0, 1, 3, 6, 10 μM of aprotinin (filled squares) and demonstrated a concentration dependence to the aprotinin inhibition of INa. The solid line represents a fit to the inhibition curve % control = a*K1/2/K1/2 + [aprotinin] + b, where K1/2 is an inhibition constant; a and b represent the aprotinin sensitive and insensitive percentages of INa, respectively. The mean control INa for the set of 25 filters used in this experiment was 4.1 ± 0.30 μA/cm2. Error bars are ± SEM.
Figure 3.
Figure 3.
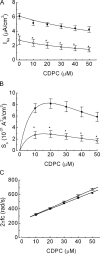
Aprotinin effect on blocker-induced fluctuation of INa in A6 cells. A6 cells in Ussing chambers were continuously voltage clamped at 0 mV and the ISC monitored on a strip chart for 30 min following addition of PBS (filled squares) or aprotinin 4 μM (open circles). Cumulative step increases in the concentration of CDPC in the apical bath were performed, the ISC and power density spectra were obtained at each blocker concentration 10, 20, 30, 40, and 50 μM. The values are given as the mean (n = 8 for PBS and n = 6 for aprotinin-treated A6 filters) ± SEM. (A) The INa following 30 min of PBS addition was significantly higher than INa following aprotinin addition (*, P < 0.01). In both conditions CDPC decreased the INa and the decrease could be explained by simple Michaelis-Menten inhibition kinetics (solid lines). (B) The So at increasing concentration of CDPC was biphasic and was fitted to a two-state channel blocking model (solid lines) in both cases. The difference in magnitude of So between PBS and aprotinin-treated A6 cells was significant (*, P < 0.01). (C) 2πfc plots with linear regressions (solid lines) from which kon and koff were calculated were virtually identical for PBS and aprotinin-treated cells.
Figure 4.
Figure 4.
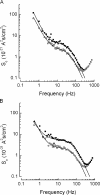
Typical current noise power spectral density in the absence (solid squares; 3.87 μA/cm2 INa) and presence (open squares; 1.67 μA/cm2 INa) of aprotinin are shown at 10 μM CDPC (A) and 30 μM CDPC (B). Corner frequencies were 47.6 and 50.2 Hz (A) (at 10 μM CDPC) in and 72.4 and 72.7 Hz (B) (at 30 μM CDPC) in the absence and presence of aprotinin, respectively. The solid lines represents the fit of the data to the sum of Lorentzian plus low frequency “1/f” noise.
Figure 5.
Figure 5.
Summary of the changes in the single channel parameters with aprotinin addition and reversal. (A) Summary of reduction in INa by aprotinin in the pulse protocol experiments. INa of cells continuously perfused with a ringer solution containing 10 μM CDPC was measured at 10-min intervals before addition of aprotinin (filled squares), then the cells were perfused with 10 μM aprotinin and INa measured at the indicated times (open squares) after which aprotinin was washed out (open triangles). At 10-min intervals, the CDPC concentration was pulsed to 30 μM and returned to 10 μM for analysis of blocker-induced fluctuations. (B) Summary of changes in iNa following perfusion of aprotinin and washout. The increase in iNa caused by aprotinin was significant (*, P < 0.01) and reversible. (C) Summary of changes in Po. The changes in Po were significant (*, P < 0.01) at 15 min after perfusing with aprotinin and returned to the pre-aprotinin control values following washout of aprotinin. (D) Summary of changes in No following aprotinin perfusion showed a significant decrease in No (*, P < 0.01) that was completely reversed upon removal of aprotinin. Values are reported as mean ± SEM for n = 8.
Figure 6.
Figure 6.
NT calculated from the Po and Kd decreased by ∼80% following 35 min of inhibition by aprotinin (open squares) compared with control conditions (solid squares). Inhibition of NT was reversed following washout of aprotinin (open triangles) and returned to control values within 30 min of washout.
Figure 7.
Figure 7.
Relationship of single channel parameters to INa. Individual values of (A) iNa, (B) Po, and (C) No under control conditions (filled squares) and during aprotinin treatment (open squares) plotted against INa. The data points from the wash conditions have been omitted for clarity. The lines are linear regressions to the control period data (solid line) and aprotinin period data (dotted line). The regressions for all three periods are summarized in Table I.
Figure 8.
Figure 8.
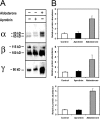
The effect of aprotinin and aldosterone on the relative abundance of ENaC subunits in the apical membrane of A6 cells. (A) A6 cells grown on permeable supports were treated either with PBS or 10 μM aprotinin for 1 h or 100 nM aldosterone for 6 h. Apical proteins were biotinylated and recovered with streptavidin–agarose beads. The recovered proteins were analyzed with antibodies against α, β, and γ Xenopus ENaC subunits. Representative Western blots are shown with the arrows indicating the migration of molecular mass standards. (B) Mean of relative changes in apical membrane abundance measured by scanning densitometry and normalized to the control density. The bars represent three independent experiments with error bars corresponding to ±SEM.

References

    1. Abramcheck, F.J., W. Van Driessche, and S.I. Helman. 1985. Autoregulation of apical membrane Na+ permeability of tight epithelia. Noise analysis with amiloride and CGS 4270. J. Gen. Physiol. 85:555–582. - PMC - PubMed
    1. Adachi, M., K. Kitamura, T. Miyoshi, T. Narikiyo, K. Iwashita, N. Shiraishi, H. Nonoguchi, and K. Tomita. 2001. Activation of epithelial sodium channels by prostasin in Xenopus oocytes. J. Am. Soc. Nephrol. 12:1114–1121. - PubMed
    1. Alvarez de la Rosa, D., H. Li, and C.M. Canessa. 2002. Effects of aldosterone on biosynthesis, traffic, and functional expression of epithelial sodium channels in A6 cells. J. Gen. Physiol. 119:427–442. - PMC - PubMed
    1. Alvarez de la Rosa, D., T.G. Paunescu, W.J. Els, S.I. Helman, and C.M. Canessa. 2004. Mechanisms of regulation of epithelial sodium channel by SGK1 in A6 cells. J. Gen. Physiol. 124:395–407. - PMC - PubMed
    1. Baxendale-Cox, L.M., R.L. Duncan, X. Liu, K. Baldwin, W.J. Els, and S.I. Helman. 1997. Steroid hormone-dependent expression of blocker-sensitive ENaCs in apical membranes of A6 epithelia. Am. J. Physiol. 273:C1650–C1656. - PubMed

Publication types