

Population pharmacokinetic analysis for nelfinavir and its metabolite M8 in virologically controlled HIV-infected patients on HAART
- PMID: 16187971
- PMCID: PMC1884828
- DOI: 10.1111/j.1365-2125.2005.02456.x
Population pharmacokinetic analysis for nelfinavir and its metabolite M8 in virologically controlled HIV-infected patients on HAART
Abstract
Aims: To describe the pharmacokinetics of nelfinavir and its main metabolite M8 in HIV-infected patients with a sustained virological response, to characterize the effect of covariates and to estimate inter- and intra-individual variability in the pharmacokinetics.
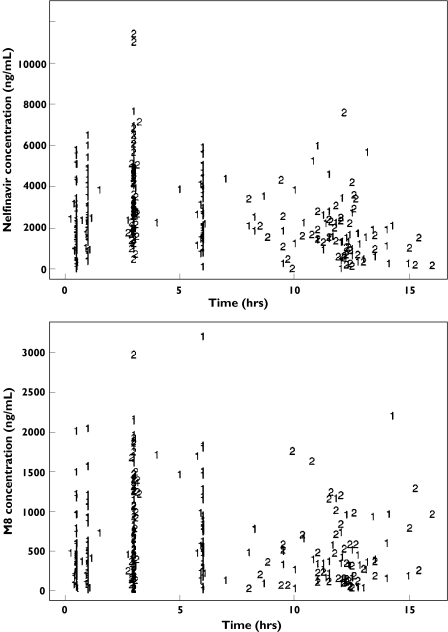
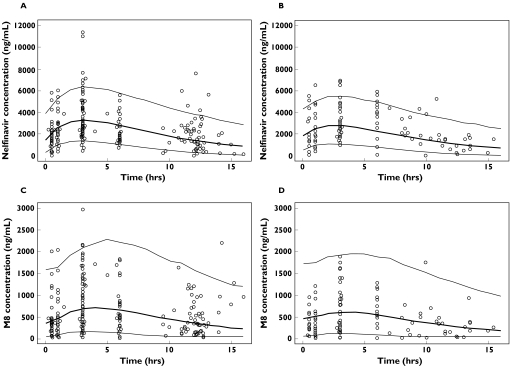
Methods: Three hundred and twenty concentrations of both nelfinavir and M8 were measured in 46 patients enrolled in the COPHAR 1-ANRS 102 study. Blood samples were taken at a first visit (one sample before drug administration and four samples at fixed times after) and at a second visit 1 to 3 months later (one before and one 3 h after drug administration). The data from both visits on nelfinavir and M8 were modelled jointly in all patients using a population approach.
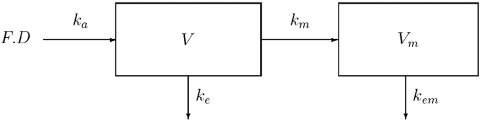
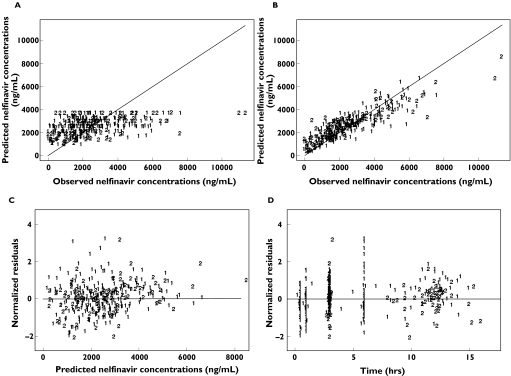
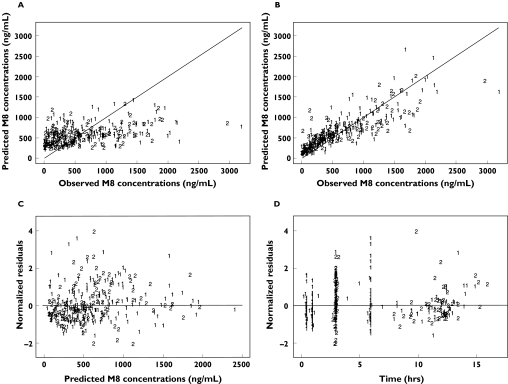
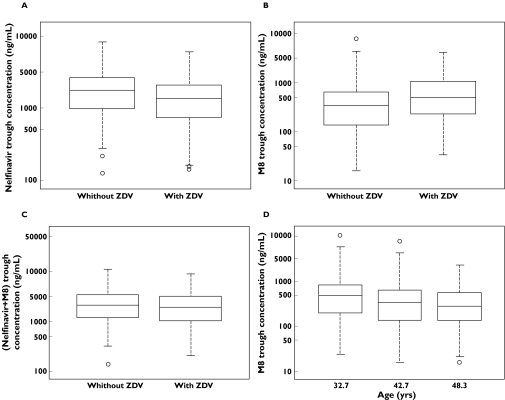
Results: A one-compartment model with first-order absorption and elimination best described nelfinavir data, with an additional compartment incorporating a first order rate-constant describing the metabolism of the drug to M8. For nelfinavir, the apparent volume of distribution (V/F ) (95% confidence interval for the mean), was 309 l (185, 516), the absorption rate constant (k(a)) was 0.4 h(-1) (0.2, 0.8), and the apparent clearance (CL/F ) was 37.3 l h(-1) (32, 44). For M8, V(m) /(Fk(m)) and CL(m)/(Fk(m)) were 866 l h(-1) (351, 2161) and 1670 l (965, 2894), respectively. The interindividual variabilities were 34.9%, 34.3% and 62.2% for V/F, CL/F and CL(m)/(Fk(m)), respectively. The interoccasion variability was 27.8% for CL/F. The mean half-lives were 05.38 h and 00.44 h for nelfinavir and M8, respectively. Significant but opposite effects of comedication with zidovudine were found on nelfinavir CL/F and M8 CL(m)/(Fk(m)), but they were not considered to be clinically relevant.
Conclusions: A joint model was found to describe adequately nelfinavir and M8 concentrations and was used to estimate pharmacokinetic parameters for M8. The model can be used to build reference pharmacokinetic profiles for therapeutic drug monitoring of the drug.
Figures
References
-
- Zhang MH, Pithavala YK, Lee CA, Lillibridge JH, Wu EY, Sandoval TM, Daniels RG, Kerr BM. Apparent genetic polymorphism in nelfinavir metabolism: evaluation of clinical relevance. 12th International Symposium on Microsomes and Drug Oxidations; Montpellier, France. 1998. Abstract 264.
-
- Zhang KE, Wu E, Patick AK, Kerr BM, Zorbas M, Lankford A, Kobayashi T, Maeda Y, Shetty B, Webber S. Circulating metabolites of the human immunodeficiency virus protease inhibitor nelfinavir in humans: structural identification, levels in plasma, and antiviral activities. Antimicrob Agents Chemother. 2001;45:1086–93. - PMC - PubMed
-
- Barry M, Mulcahy F, Merry C, Gibbons S, Back D. Pharmacokinetics and potential interactions amongst antiretroviral agents used to treat patients with HIV infection. Clin Pharmacokinet. 1999;36:289–304. - PubMed
-
- Burger DM, Hugen PWH, Aarnouste RE, Hoetelmans RMW. Treatment failure of nelfinavir-containing triple therapy can largely be explained by low nelfinavir plasma concentrations. AIDS. 2003;17:1157–65. - PubMed
Publication types
MeSH terms
Substances
LinkOut - more resources
Full Text Sources
Medical
