Comparative Study
. 2005 Oct 22;272(1577):2165-72.
doi: 10.1098/rspb.2005.3194.

Adaptive sex differences in growth of pre-ovulation oocytes in a passerine bird

Affiliations
Comparative Study

Adaptive sex differences in growth of pre-ovulation oocytes in a passerine bird

Alexander V Badyaev et al. Proc Biol Sci. .

Abstract

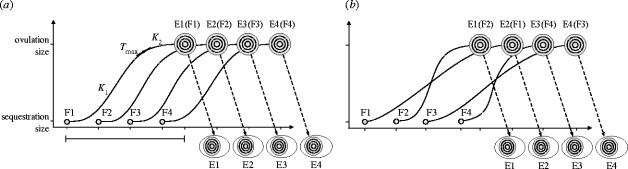
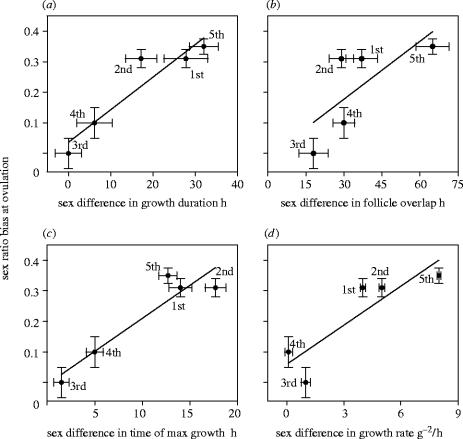
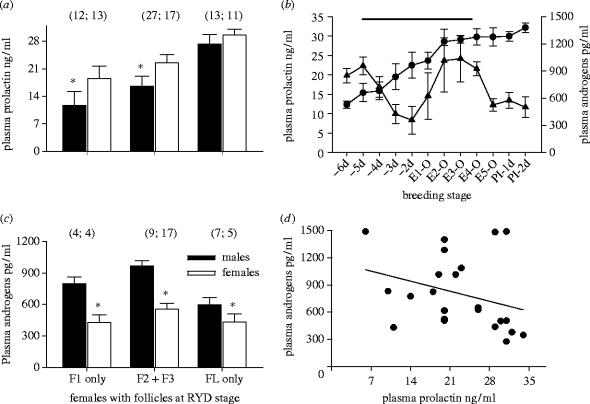
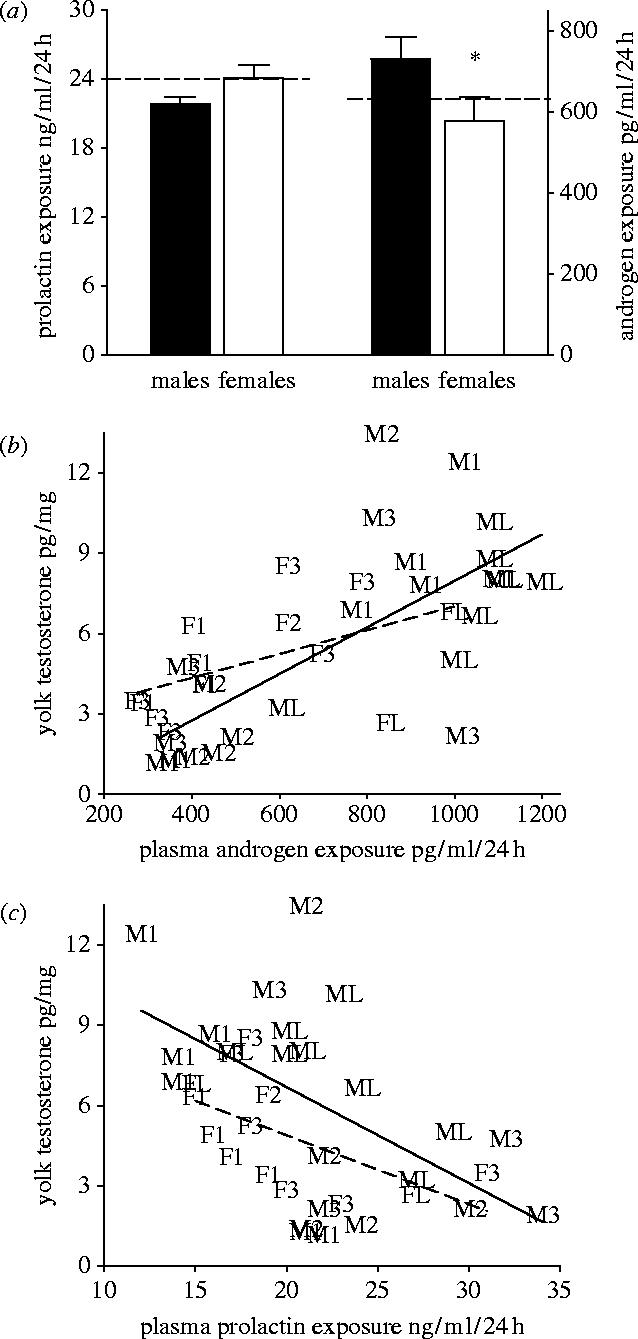
Maternal modification of offspring sex in birds has strong fitness consequences, however the mechanisms by which female birds can bias sex of their progeny in close concordance with the environment of breeding are not known. In recently established populations of house finches (Carpodacus mexicanus), breeding females lay a sex-biased sequence of eggs when ambient temperature causes early onset of incubation. We studied the mechanisms behind close association of incubation and sex-determination strategies in this species and discovered that pre-ovulation oocytes that produce males and females differed strongly in the temporal patterns of proliferation and growth. In turn, sex-specific exposure of oocytes to maternal secretion of prolactin and androgens produced distinct accumulation of maternal steroids in oocyte yolks in relation to oocyte proliferation order. These findings suggest that sex difference in oocyte growth and egg-laying sequence is an adaptive outcome of hormonal constraints imposed by the overlap of early incubation and oogenesis in this population, and that the close integration of maternal incubation, oocytes' sex-determination and growth might be under control of the same hormonal mechanism. We further document that population establishment and the evolution of these maternal strategies is facilitated by their strong effects on female and offspring fitness in a recently established part of the species range.


Figures

Figure 1
Figure 1
Schematic illustration of temporal sequence of oocyte RYD phase, ovulation and egg-laying in a bird. (a) Traditional view: hierarchical order of oocyte sequestration (F1–F4) into RYD phase is maintained at ovulation and egg-laying (E1–E4) because of similar RYD growth pattern among oocytes. The sigmoid growth of F1 shows growth parameters measured in this study: K1, initial growth rate; K2, late growth rate; Tmax, time of maximum growth, the horizontal line shows total duration of RYD phase of F1 and is the same for all oocytes. In this example, during its RYD growth, F1 overlaps with growth of F2 for 24 h, with growth of F2+F3 for 24 h, and with growth of F2+F3+F4 for 24 h. (b) Hypothetical view: when RYD growth rate and duration differ among oocytes, the hierarchical order of sequestration (F1–F4) might not be maintained at ovulation (in this example, F2, F1, F4, F3). Growing oocytes would differ in the duration of overlap with RYD phase of other oocytes, and variation in RYD growth patterns could expose growing oocytes to distinct maternal hormonal profiles and lead to accumulation of distinct hormonal concentrations in oocyte yolk prior to ovulation.
Figure 2
Figure 2
Relationship between sex-ratio at ovulation (in deviations from 50% males : 50% females for each ovulation position) and sex differences (female minus male value) in (a) duration of oocyte growth (hours), (b) overlap in RYD growth with other RYD oocytes (cumulative hours), (c) time of maximum growth (hours), (d) growth rate (g−2 h−1). Numbers are ovulation order (1–5), standard errors (s.e.) for sex-ratio data are calculated from the among-year deviations during 1995–2003, s.e. for growth parameters are from resampling with replacement, for each ovulation position, of growth data for all oocytes for both sexes (table 1).
Figure 3
Figure 3
(a) Circulating plasma prolactin (PRL) of females with oocytes at the RYD phase in relation to oocyte sex and ovulation order. Shown are non-overlapping groups of females that had only one—the first (‘F1- only’) or the last (‘FL-only’) oocyte at the RYD phase at the time of plasma sampling. ‘F2+F3’ were females that had the second and the third oocyte at the RYD stage at the time of sampling. Sample sizes for each follicle and sex are in parentheses. (b) Plasma PRL (circle; n=82 females) and androgen (triangle; n=28) of females that began full incubation with the first egg. Horizontal line shows period of RYD of follicles within a clutch. E1-O indicates the ovulation of the first egg, E2-O is the ovulation of the second egg, laying of the first egg, and the onset of full incubation. PI-1d indicates the first day of the post-egg laying incubation. (c) Circulating plasma androgens (T+5α-DHT) of females with RYD oocytes that became males and females. Asterisk indicates differences between sexes within each group. (d) Relationship between circulating PRL and androgens in females with RYD phase oocytes.
Figure 4
Figure 4
(a) Mean daily concentrations of female plasma PRL and androgen during RYD phase of male (n=36) and female (n=33) oocytes. Dashed line indicates average level of PRL (left) and androgens (right) throughout the oocytes' RYD phase. (b) Relationship between mean daily concentrations of plasma androgens of the mother throughout an oocyte's RYD phase and the total concentration of androgens in the yolk of this oocyte (male oocytes, solid line; female oocytes, dashed line). (c) Relationship between mean daily plasma PRL concentrations throughout an oocyte's RYD phase and total concentrations of androgens in the yolk of this oocyte (male oocytes, solid line; female oocytes, dashed line). Letter followed by number indicates sex (Male or Female) and order of ovulation (1, 2, 3, last).
Figure 5
Figure 5
Fitness contour plot of number of offspring surviving to dispersal age in relation to female's onset of incubation and the sex-biased laying order (shown as deviations from the population specific sex-bias in egg-laying sequence) in clutches of 116 females from 1995–2003.

References

    1. Andersson M, Wallander J, Oring L, Akst E, Reed J.M, Fleischer R.C. Adaptive seasonal trend in brood sex ratio: test in two sister species with contrasting breeding systems. J. Evol. Biol. 2003;16:510–515. - DOI - PubMed
    1. Ankney C.D. Sex ratio varies with egg sequence in lesser snow geese. Auk. 1982;99:662–666.
    1. Astheimer L.B, Grau C.R. A comparison of yolk growth rates in seabird eggs. Ibis. 1990;132:380–394.
    1. Badyaev, A.V. in press Maternal inheritance and rapid evolution of sexual size dimorphism: passive effects or active strategies? Am. Nat.165 - PubMed
    1. Badyaev A.V, Martin T.E. Sexual dimorphism in relation to current selection in the house finch. Evolution. 2000;54:987–997. - PubMed

Publication types