

A TNF-induced gene expression program under oscillatory NF-kappaB control
- PMID: 16191192
- PMCID: PMC1262712
- DOI: 10.1186/1471-2164-6-137
A TNF-induced gene expression program under oscillatory NF-kappaB control
Abstract
Background: The cytokine tumor necrosis factor (TNF) initiates tissue inflammation, a process mediated by the NF-kappaB transcription factor. In response to TNF, latent cytoplasmic NF-kappaB is activated, enters the nucleus, and induces expression of inflammatory and anti-apoptotic gene expression programs. Recently it has been shown that NF-kappaB displays two distinct activation modes, monophasic and oscillatory, depending on stimulus duration. Characterization of temporal expression patterns for the NF-kappaB network and determination of those genes under monophasic- or oscillatory control has not been experimentally addressed.
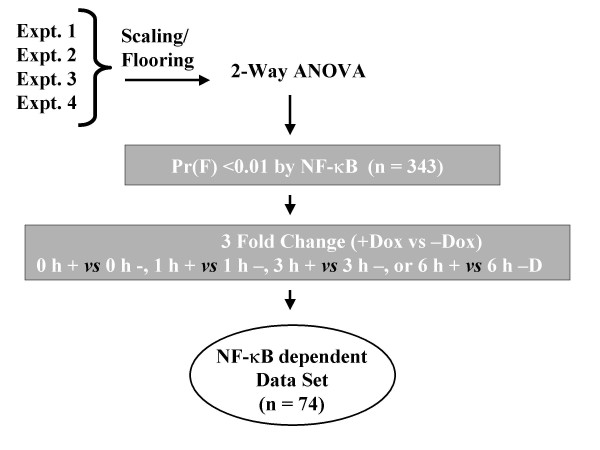
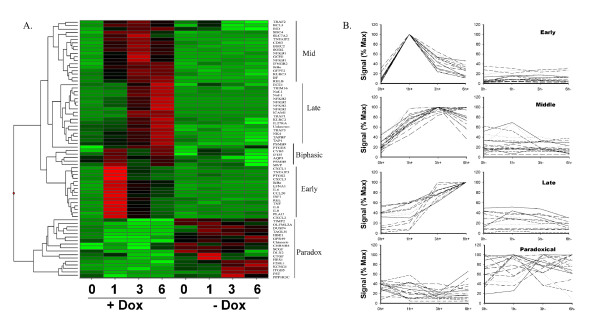
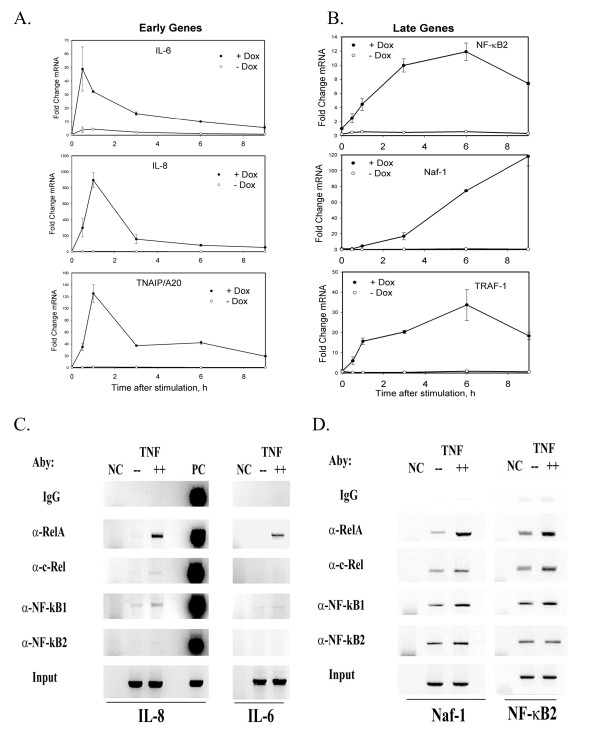
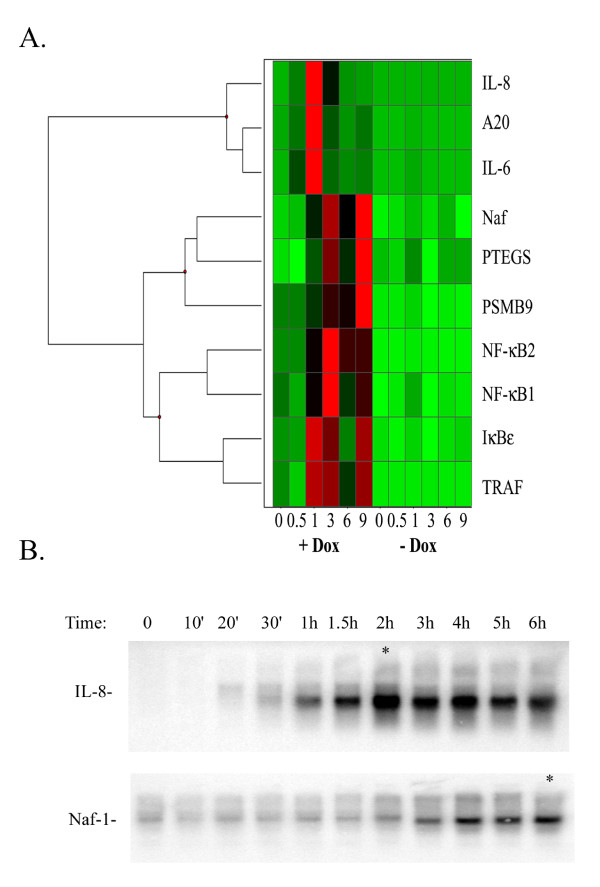
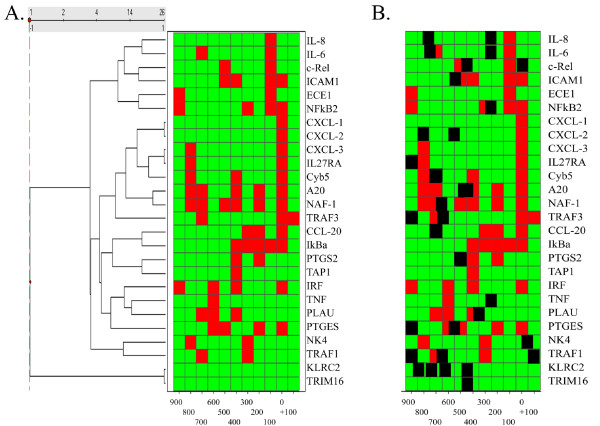
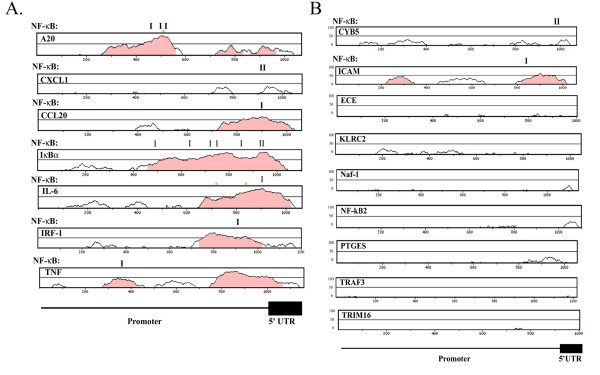
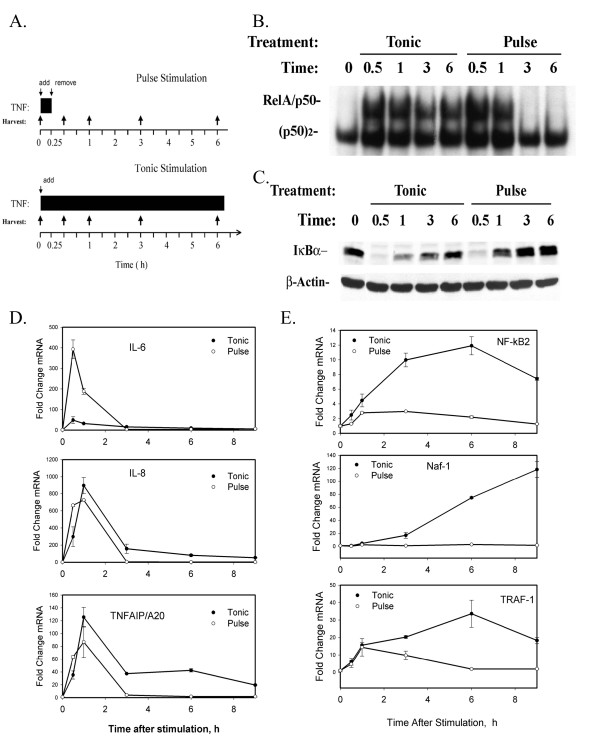
Results: To identify the kinetics of NF-kappaB-dependent gene expression and determine whether these two types of NF-kappaB translocation modes control distinct gene programs, a detailed kinetic analysis of a validated microarray data set was performed on 74 unique NF-kappaB-dependent genes in response to TNF. Hierarchical clustering identified distinct expression profiles termed the "Early", "Middle", "Late" response groups, peaking 1, 3, and 6 h after stimulation, respectively. These expression patterns were validated by Quantitative Real Time PCR (Q-RT-PCR) and NF-kappaB binding was demonstrated by chromatin immunoprecipitation (ChIP) assays. Each response group was mapped to its molecular function; this analysis indicated that the Early group encodes cytokines or negative regulators of the IKK-NF-kappaB pathway, and the Late group encodes cell surface receptors, adhesion molecules and signal adapters. That similar coordinated sequential cascades of gene expression were also seen in response to stimulation by the cytokine IL-1, and expression patterns observed in MRC-5 fibroblasts indicated that the epithelial NF-kappaB program is relatively stimulus- and cell type-independent. Bioinformatic analysis of the Early and Late gene promoters indicates that although both groups contain similar patterns of NF-kappaB-binding sites, only the Early gene promoters contain NF-kappaB-binding sites located in phylogenetically conserved domains. Stimulation protocols designed to produce either monophasic or oscillatory NF-kappaB activation modes showed that the oscillatory mode is required only for expression of the Late genes.
Conclusion: This analysis provides important insights into the TNF-regulated genetic response program in epithelial cells, where NF-kappaB controls sequential expression patterns of functionally distinct genes that depend on its oscillatory activation mode.
Figures
Similar articles
-
Identification of direct genomic targets downstream of the nuclear factor-kappaB transcription factor mediating tumor necrosis factor signaling.J Biol Chem. 2005 Apr 29;280(17):17435-48. doi: 10.1074/jbc.M500437200. Epub 2005 Feb 18. J Biol Chem. 2005. PMID: 15722553
-
Differential effects of TNF-alpha and IFN-gamma on gene transcription mediated by NF-kappaB-Stat1 interactions.J Interferon Cytokine Res. 2005 Nov;25(11):707-19. doi: 10.1089/jir.2005.25.707. J Interferon Cytokine Res. 2005. PMID: 16318585
-
Pathway-specific profiling identifies the NF-kappa B-dependent tumor necrosis factor alpha-regulated genes in epidermal keratinocytes.J Biol Chem. 2005 May 13;280(19):18973-80. doi: 10.1074/jbc.M411758200. Epub 2005 Feb 18. J Biol Chem. 2005. PMID: 15722350
-
Regulation and function of IKK and IKK-related kinases.Sci STKE. 2006 Oct 17;2006(357):re13. doi: 10.1126/stke.3572006re13. Sci STKE. 2006. PMID: 17047224 Review.
-
The NF-kappaB regulatory network.Cardiovasc Toxicol. 2006;6(2):111-30. doi: 10.1385/ct:6:2:111. Cardiovasc Toxicol. 2006. PMID: 17303919 Review.
Cited by
-
The dependence of expression of NF-κB-dependent genes: statistics and evolutionary conservation of control sequences in the promoter and in the 3' UTR.BMC Genomics. 2012 May 11;13:182. doi: 10.1186/1471-2164-13-182. BMC Genomics. 2012. PMID: 22577947 Free PMC article.
-
TNIP1, a retinoic acid receptor corepressor and A20-binding inhibitor of NF-κB, distributes to both nuclear and cytoplasmic locations.J Histochem Cytochem. 2011 Dec;59(12):1101-12. doi: 10.1369/0022155411427728. J Histochem Cytochem. 2011. PMID: 22147607 Free PMC article.
-
Time-varying stimuli that prolong IKK activation promote nuclear remodeling and mechanistic switching of NF-κB dynamics.bioRxiv [Preprint]. 2024 Oct 1:2024.09.26.615244. doi: 10.1101/2024.09.26.615244. bioRxiv. 2024. Update in: Nat Commun. 2025 Aug 8;16(1):7329. doi: 10.1038/s41467-025-62837-0. PMID: 39386677 Free PMC article. Updated. Preprint.
-
Crosstalk in inflammation: the interplay of glucocorticoid receptor-based mechanisms and kinases and phosphatases.Endocr Rev. 2009 Dec;30(7):830-82. doi: 10.1210/er.2009-0013. Epub 2009 Nov 4. Endocr Rev. 2009. PMID: 19890091 Free PMC article. Review.
-
Stapling proteins in the RELA complex inhibits TNFα-induced nuclear translocation of RELA.RSC Chem Biol. 2021 Oct 28;3(1):32-36. doi: 10.1039/d1cb00183c. eCollection 2022 Jan 5. RSC Chem Biol. 2021. PMID: 35128406 Free PMC article.
References
-
- Beutler B. TNF, immunity and inflammatory disease: Lessons of the past decade. J Invest Med. 1995;43:227–235. - PubMed
-
- Brasier AR, Li J. Mechanisms for inducible control of angiotensinogen gene transcription. J Hypertens. 1996;27(2):465–475. - PubMed
-
- Raingeaud J, Gupta S, Rogers JS, Dickens M, Han J, Ulevitch RJ, Davis RJ. Pro-inflammatory cytokine and environmental stress cause p38 mitogen-activated protein kinase activation by dual phosphorylation on tyrosine and threonine. J Biol Chem. 1995;270:7420–7426. doi: 10.1074/jbc.270.13.7420. - DOI - PubMed
Publication types
MeSH terms
Substances
Grants and funding
LinkOut - more resources
Full Text Sources
Other Literature Sources
