Evolution of body size in Galapagos marine iguanas
- PMID: 16191607
- PMCID: PMC1559900
- DOI: 10.1098/rspb.2005.3205
Evolution of body size in Galapagos marine iguanas
Abstract
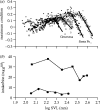
Body size is one of the most important traits of organisms and allows predictions of an individual's morphology, physiology, behaviour and life history. However, explaining the evolution of complex traits such as body size is difficult because a plethora of other traits influence body size. Here I review what we know about the evolution of body size in a group of island reptiles and try to generalize about the mechanisms that shape body size. Galapagos marine iguanas occupy all 13 larger islands in this Pacific archipelago and have maximum island body weights between 900 and 12 000g. The distribution of body sizes does not match mitochondrial clades, indicating that body size evolves independently of genetic relatedness. Marine iguanas lack intra- and inter-specific food competition and predators are not size-specific, discounting these factors as selective agents influencing body size. Instead I hypothesize that body size reflects the trade-offs between sexual and natural selection. We found that sexual selection continuously favours larger body sizes. Large males establish display territories and some gain over-proportional reproductive success in the iguanas' mating aggregations. Females select males based on size and activity and are thus responsible for the observed mating skew. However, large individuals are strongly selected against during El Niño-related famines when dietary algae disappear from the intertidal foraging areas. We showed that differences in algae sward ('pasture') heights and thermal constraints on large size are causally responsible for differences in maximum body size among populations. I hypothesize that body size in many animal species reflects a trade-off between foraging constraints and sexual selection and suggest that future research could focus on physiological and genetic mechanisms determining body size in wild animals. Furthermore, evolutionary stable body size distributions within populations should be analysed to better understand selection pressures on individual body size.
Figures


Similar articles
-
BODY SIZE AND SEXUAL SIZE DIMORPHISM IN MARINE IGUANAS FLUCTUATE AS A RESULT OF OPPOSING NATURAL AND SEXUAL SELECTION: AN ISLAND COMPARISON.Evolution. 1997 Jun;51(3):922-936. doi: 10.1111/j.1558-5646.1997.tb03673.x. Evolution. 1997. PMID: 28568579
-
Ecological and evolutionary influences on body size and shape in the Galápagos marine iguana (Amblyrhynchus cristatus).Oecologia. 2016 Jul;181(3):885-94. doi: 10.1007/s00442-016-3618-1. Epub 2016 Apr 4. Oecologia. 2016. PMID: 27041683
-
Is there an endogenous tidal foraging rhythm in marine iguanas?J Biol Rhythms. 1995 Dec;10(4):335-50. doi: 10.1177/074873049501000407. J Biol Rhythms. 1995. PMID: 8639942
-
The genetic basis of traits regulating sperm competition and polyandry: can selection favour the evolution of good- and sexy-sperm?Genetica. 2008 Sep;134(1):5-19. doi: 10.1007/s10709-007-9162-5. Epub 2007 Jul 7. Genetica. 2008. PMID: 17619174 Review.
-
Female competition and its evolutionary consequences in mammals.Biol Rev Camb Philos Soc. 2011 May;86(2):341-66. doi: 10.1111/j.1469-185X.2010.00149.x. Biol Rev Camb Philos Soc. 2011. PMID: 20636474 Review.
Cited by
-
High costs of female choice in a lekking lizard.PLoS One. 2007 Jun 27;2(6):e567. doi: 10.1371/journal.pone.0000567. PLoS One. 2007. PMID: 17593966 Free PMC article.
-
Stress physiology as a predictor of survival in Galapagos marine iguanas.Proc Biol Sci. 2010 Oct 22;277(1697):3157-62. doi: 10.1098/rspb.2010.0678. Epub 2010 May 26. Proc Biol Sci. 2010. PMID: 20504812 Free PMC article.
-
Charles Darwin's Origin of Species, directional selection, and the evolutionary sciences today.Naturwissenschaften. 2009 Nov;96(11):1247-63. doi: 10.1007/s00114-009-0603-0. Epub 2009 Sep 16. Naturwissenschaften. 2009. PMID: 19756462
-
Genomic insights into the mechanisms of body size evolution in Serpentes.BMC Genomics. 2025 Apr 29;26(1):420. doi: 10.1186/s12864-025-11601-1. BMC Genomics. 2025. PMID: 40301758 Free PMC article.
-
Alfred Russel Wallace and the destruction of island life: the Iguana tragedy.Theory Biosci. 2013 Dec;132(4):259-65. doi: 10.1007/s12064-013-0193-4. Epub 2013 Aug 24. Theory Biosci. 2013. PMID: 23975644
References
-
- Abzhanov A, Protas M, Grant B.R, Grant P.R, Tabin C.J. Bmp4 and morphological variation of beaks in Darwin's finches. Science. 2004;305:1462–1465. doi:10.1126/science.1098095 - DOI - PubMed
-
- Arnold S.J. Morphology, performance and fitness. Am. Zool. 1983;23:347–361.
-
- Arnold S.J, Wade M.J. On the measurement of natural and sexual selection: applications. Evolution. 1984;38:720–734. - PubMed
-
- Bartholomew G.A. A field study of temperature relations in the Galapagos marine iguana. Copeia. 1966;2:241–250.
-
- Boback S.M. Body size evolution in snakes: evidence from island populations. Copeia. 2003;39:81–94.
Publication types
MeSH terms
LinkOut - more resources
Full Text Sources

