. 2005 Oct;89(4):2835-54.
doi: 10.1529/biophysj.104.058461.

Yeast kinetochore microtubule dynamics analyzed by high-resolution three-dimensional microscopy

Affiliations

Yeast kinetochore microtubule dynamics analyzed by high-resolution three-dimensional microscopy

J F Dorn et al. Biophys J. 2005 Oct.

Abstract

We have probed single kinetochore microtubule (k-MT) dynamics in budding yeast in the G1 phase of the cell cycle by automated tracking of a green fluorescent protein tag placed proximal to the centromere on chromosome IV and of a green fluorescent protein tag fused to the spindle pole body protein Spc42p. Our method reliably distinguishes between different dynamics in wild-type and mutant strains and under different experimental conditions. Using our methods we established that in budding yeast, unlike in metazoans, chromosomes make dynamic attachments to microtubules in G1. This makes it possible to interpret measurements of centromere tag dynamics as reflecting k-MT dynamics. We have examined the sensitivity of our assay by studying the effect of temperature, exposure to benomyl, and a tubulin mutation on k-MT dynamics. We have found that lowering the temperature and exposing cells to benomyl attenuate k-MT dynamics in a similar manner. We further observe that, in contrast to previous reports, the mutant tub2-150 forms k-MTs that depolymerize faster than wild type. Based on these findings, we propose high-resolution light microscopy of centromere dynamics in G1 yeast cells as a sensitive assay for the regulation of single k-MT dynamics.


Figures
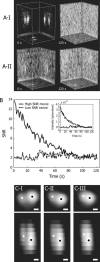
FIGURE 1
FIGURE 1
3D image stacks of spindle pole body and centromere tag acquired by fast sampling and low light exposure. (A-I and A-II) 3D maximum projections of the first and the last images in a raw movie with initially high (A-I) and low (A-II) signal/noise ratio. The size of the stacks is 3 × 3 × 4 μm. See supplementary movies S1 and S2 for animated image sequences. (B) SNR and signal intensities (inset) of the brighter of the two tags in the movie shown in panels A-I (S1, solid line) and A-II (S2, dashed line). The SNR decreases with the decay in intensity induced by photobleaching. (C-I–C-III) Maximum projections of noise-filtered, overlapping tag signals. Although the two tags are clearly separable in the image on the left (C-I), their signals frequently overlap (C-II), and become indistinguishable by visual inspection (C-III). Black and white dots, positions of SPB and CEN tag, respectively, as determined by 3D high-resolution microscopy. Bar, 200 nm.
FIGURE 2
FIGURE 2
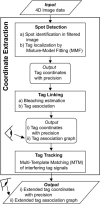
Flow chart of the algorithm used to extract tag trajectories from four-dimensional (3D space + time) image data. The spot detection module separates significant spot signals from noise, and applies a mixture-model fitting of multiple point-spread functions to localize one or several tags in each spot. The tag linking module establishes tag correspondence between consecutive frames. The tag tracking module localizes previously unresolved tags by multitemplate matching. Eyes indicate where a graphical user interface allows the user to manipulate otherwise automatically generated data.
FIGURE 3
FIGURE 3
Tag distance trajectory analysis to classify microtubule dynamics. (A) SPB-CEN distance trajectories (black solid line), are partitioned into periods of antipoleward (AP, dark gray dashed line) and poleward (TP, light gray dashed line) movements and pause (light gray dotted line). Undetermined periods remain black. Intervals containing deleted frames (gray solid line) are not analyzed. Each distance value is attributed with a 66% confidence interval, derived from noise estimates in the raw image. These uncertainty estimates are exploited by the classification scheme to formulate a series of statistical tests (see Materials and Methods). Asterisks mark trajectory intervals between consecutive time points with statistically significant AP and TP movements. These intervals are then expanded to longer periods of AP and TP movement, if adjacent, initially insignificant intervals provide sufficient ensemble evidence for either of the movement classes. Bars at the bottom of the panel encode the classification of movements used for the calculation of the frequencies of directional switches. (B) Flowchart of the classification algorithm.
FIGURE 4
FIGURE 4
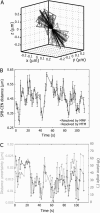
Influence of the 3D positions of spindle pole body and centromere on uncertainties in the distance between them. (A) Motion of SPB (dark gray) and CEN (light gray) tags in a WT cell in G1. The black lines connect the positions of the two tags at each time point, where the midpoint between each pair was taken as the origin for their coordinates at each time point. Animated SPB and CEN tag trajectories for the two movies in Fig. 1, A-I–A-II, are shown in supplementary movies S3 and S4. (B) SPB-CEN distance trajectory with distance uncertainties propagated by the tracking algorithm. Uncertainties are generally larger for distances resolved by MTM (light gray dots) than for distances resolved by MMF (dark gray stars), and they increase with increasing off-plane angle as well as toward the end of the movie as the SNR decreases. (C) Influence of nuclear rotation on distance uncertainty. Uncertainties (light gray) and corresponding off-plane angles of the SPB-CEN axis (dark gray) are shown to indicate how increasing off-plane angles amplify the distance uncertainty because of the narrower axial bandpass of the microscope optics.
FIGURE 5
FIGURE 5
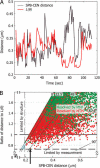
Resolution in tracking SPB-CEN distances. (A) SPB and CEN tags are resolved by the described image analysis even if the tag-to-tag distance (black) is less than the inverse of the OTF frequency cutoff (red; e.g., between time points 30 and 40 s the distance is up to 25% below this resolution limit). (B) Scatter plot of SPB-CEN distance and the ratio between SPB-CEN distance and inverse of the OTF frequency cutoff at the corresponding SPB-CEN axis orientation. The distribution is sampled by ∼20,000 distance measurements. Data points with a ratio below 1 rely on the ability of MMF and MTM tag tracking to resolve spots separated by less than the inverse of the OTF frequency cutoff. Green, distances resolved by MMF; red, distances resolved by MTM. Distances could be resolved at a ratio of 0.75 (horizontal dashed line). See supplementary movie S5 for a visual demonstration of the resolution performance of MMF and MTM tracking. At 0° off-plane orientation of the SPB-CEN axis a ratio 0.75 corresponds to a minimum resolvable distance of 170 nm. However, our data contained no distance smaller than ∼200 nm (vertical dashed line). The absence of data points in the blue shaded region suggests a structural limit for the experimentally found minimum SPB-CEN tag distance.
FIGURE 6
FIGURE 6
Mean squared SPB-CEN distance change versus time lag. CEN-tag movements in ndc10-1 strains are substantially less constrained than in WT or tub2-150. The latter strains are indistinguishable by MSQD statistics. Data sampled at a frame rate of 1/s follow the same trend as data sampled at a frame rate 1/(5 s) and would reach the same plateau of constrained diffusional motion. Ranges of the MSQD plateau for constrained diffusion extrapolated from 1-s trajectories are indicated for ndc10-1 (dashed lines) and WT and tub2-150 (dotted lines).
FIGURE 7
FIGURE 7
Discrimination of phenotypes based on MT (SPB-CEN distance) dynamics. (A) Discrimination based in antipoleward (AP) speeds. Values below the diagonal indicate the p-values for the null hypothesis that the mean speed between two experimental conditions is equal. Values above the diagonal indicate p-values for the null hypothesis that the aligned speed distributions are equal. Gray levels encode the significance level (1 − p-value) for two mean speeds or distributions being different. (B) Comparison of AP and TP speeds within one experimental condition. Left column, difference between AP and TP mean speeds; right column, difference between AP and TP speed distributions. (C) Discrimination based on poleward (TP) speeds. Abbreviations: w(o)b, with(out) benomyl; ndc10, ndc10-1; tub2, tub2-150. wtXX, WT at XX°C.
FIGURE 8
FIGURE 8
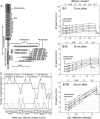
Influence of centromere (CEN) tag offset from the kinetochore on trajectory analysis. (A) Schematic drawing of the position of the centromere marker (after De Wulf et al. (1)). The offset of the tag center from the kinetochore depends on the compaction of yeast G1 chromosomes. (B) Influence of rotational diffusion of the CEN tag about the kinetochore on antipoleward (AP) speeds for tag offsets of (I) 50 nm, (II) 90 nm, and (III) 160 nm. Seven rates of tubulin association during growth are considered, incrementing in steps of 5% between indices. Arrows indicate the maximum deviation of the speeds from their values without offset (first data point for every sequence) among all seven simulations. (C) Distinguishability of trajectories as a function of tag offset and rotational diffusion constant. Dark gray curves display the number of simulation pairs with a difference in the association rate of 5% (solid line) and 10% (dashed line) that can be distinguished by comparison of the means of the AP speeds. The number of distinguishable pairs decreases with increasing offset and diffusion constant. Light gray curves show the number of 5% increment (solid line) and 10% increment (dashed line) pairs with differing speed distributions. The higher the influence of the diffusing offset, the stronger the difference of the speed distribution.
FIGURE 9
FIGURE 9
Analysis of kinetochore microtubule dynamics in yeast requires 3D imaging. (A) SPB-CEN distance trajectory calculated from complete 3D tracks (black); from tracks generated by maximum projection of image data onto the xy-plane (light gray); and from tracks sampled in frames containing both tag signals in the same plane in focus (dark gray). (B) Discrimination matrices for the comparison of AP speed of 3D and 2D trajectories of WT and tub2-150 at 34°C with and without benomyl. Two-dimensional trajectories modify the significance levels of mean speed and speed distribution discrimination substantially. See Fig. 7 for gray level codes and abbreviations.
FIGURE 10
FIGURE 10
Influence of the frame rate on antipoleward speed. (A) AP speeds strongly diminish with undersampling. Speeds were extracted by artificially subsampling experimental data acquired at a frame rate of 1/s on WT and tub2-150 at 34°C, with and without benomyl. (B) Discrimination matrix of AP speeds at 1-, 2-, 5-, and 10-s sampling intervals. With the exception of tub2-150 without benomyl, the sensitivity in distinguishing different strains and conditions decreases with lower sampling rates. See Fig. 7 for gray level codes and abbreviations.
FIGURE 11
FIGURE 11
Convergence of estimated antipoleward and poleward speeds for WT at 37°C as a function of the number of data points. Colors refer to 10 randomly permuted trajectory sequences. At least 350 events of AP or TP motion are required to estimate stable AP or TP speeds (vertical dashed line). On average, a trajectory of 100 s, sampled at 1 s, contains 18 events of AP and TP movement. Therefore, 20–25 movies are required per condition to characterize its phenotype in microtubule dynamics.
FIGURE 12
FIGURE 12
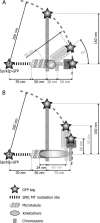
Models for the geometric configurations of SPB and CEN tags near the 200-nm minimum distance. The distance between the GFP-tagged Spc42p and MT nucleation site is ∼70 nm, and the shortest MT in the yeast interphase nucleus is ∼50 nm. (A) Configuration with a kinetochore of length 0. The minimum distance of 200 nm can be explained by CEN tag offsets with angles between chromosome arm and MT axis of 90 and 36° for offsets of 160 and 90 nm, respectively. An offset of 50 nm requires a minimum kinetochore length of 30 nm. (B) Configuration with a mean angle between chromosome arm and MT axis of 90°. Assuming a kinetochore-to-MT overlap of three dimer layers, the length of the kinetochore is estimated to be 25, 85, and 100 nm for offsets of 160, 90, and 50 nm, respectively.

References

    1. De Wulf, P., A. D. McAinsh, and P. K. Sorger. 2003. Hierarchical assembly of the budding yeast kinetochore from multiple subcomplexes. Genes Dev. 17:2902–2921. - PMC - PubMed
    1. McAinsh, A. D., J. D. Tytell, and P. K. Sorger. 2003. Structure, function, and regulation of budding yeast kinetochores. Annu. Rev. Cell Dev. Biol. 19:519–539. - PubMed
    1. Mitchison, T., and M. Kirschner. 1984. Dynamic instability of microtubule growth. Nature. 312:237–242. - PubMed
    1. Kinoshita, K., I. Arnal, A. Desai, D. N. Drechsel, and A. A. Hyman. 2001. Reconstitution of physiological microtubule dynamics using purified components. Science. 294:1340–1343. - PubMed
    1. Janson, M. E., M. E. de Dood, and M. Dogterom. 2003. Dynamic instability of microtubules is regulated by force. J. Cell Biol. 161:1029–1034. - PMC - PubMed

Publication types

MeSH terms