Comparative Study
. 2005 Oct;242(4):530-7; discussion 537-9.
doi: 10.1097/01.sla.0000184693.61680.24.

Surgeon contribution to hospital bottom line: not all are created equal

Affiliations
Comparative Study

Surgeon contribution to hospital bottom line: not all are created equal

Andrew S Resnick et al. Ann Surg. 2005 Oct.

Abstract

Objective: We hypothesized that surgeon productivity is directly related to hospital operating margin, but significant variation in margin contribution exists between specialties.

Summary background data: As the independent practitioner becomes an endangered species, it is critical to better understand the surgeon's importance to a hospital's bottom line. An appreciation of surgeon contribution to hospital profitability may prove useful in negotiations relating to full-time employment or other models.

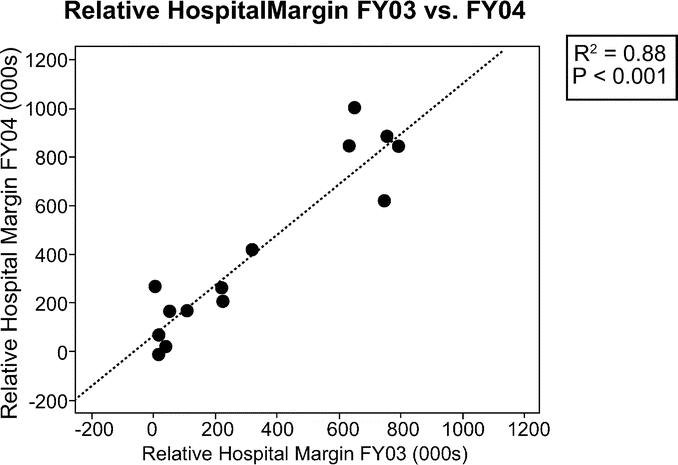
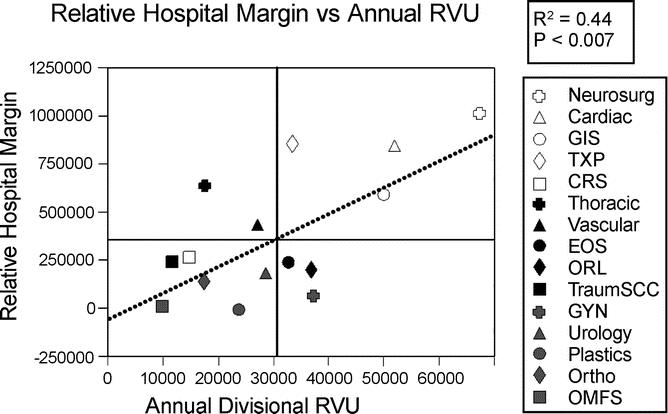
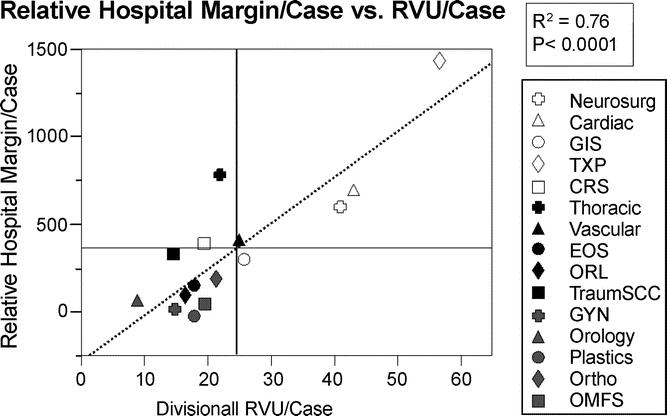
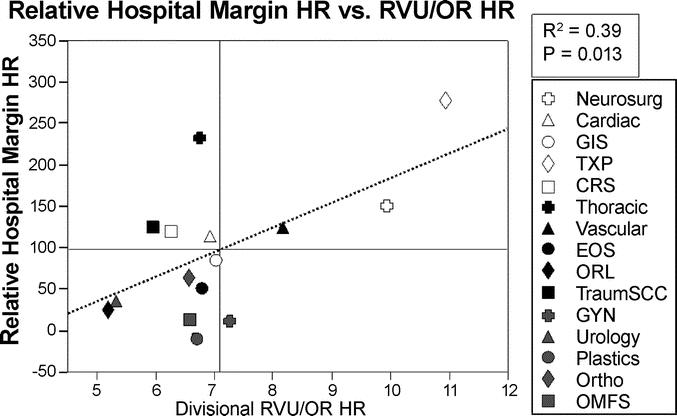
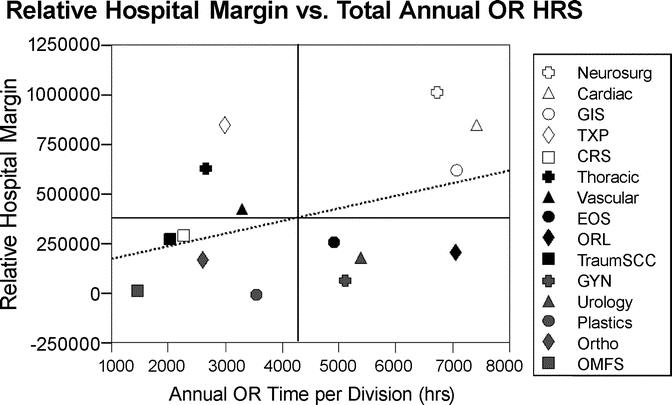
Methods: Surgeon total relative value units (RVUs), a measure of productivity, were collected from operating room (OR) logs. Annual hospital margin per specialty was provided by hospital finance. Hospital margin data were normalized by dividing by a constant such that the highest relative hospital margin (RHM) in fiscal year 2004 expressed as margin units (mu) was 1 million mu. For each specialty, data analyzed included RHM/OR HR, RHM/case, and RHM/RVU.

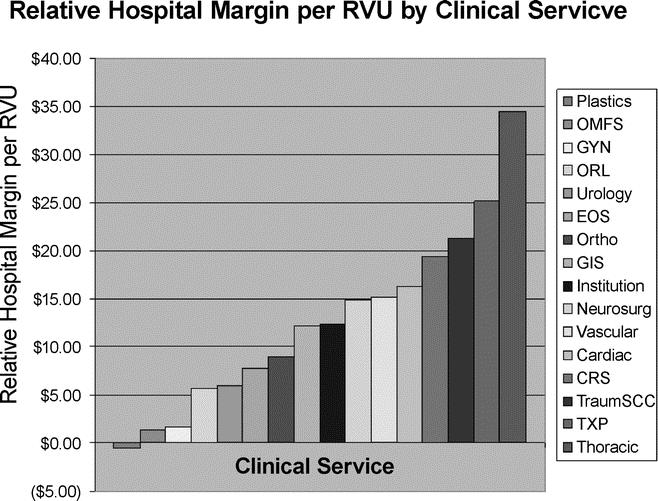
Results: Thoracic (34.55 mu/RVU) and transplant (25.13 mu/RVU) were the biggest contributors to hospital margin. Plastics (-0.57 mu/RVU), maxillofacial (1.41 mu/RVU), and gynecology (1.66 mu/RVU) contributed least to hospital margin. Relative hospital margin per OR HR for transplant slightly exceeded thoracic (275.74 mu vs 233.94 mu) at the top and plastics and maxillofacial contributed the least (-3.83 mu/OR HR vs 9.36 mu/OR HR).

Conclusions: Surgeons contribute significantly to hospital margin with certain specialties being more profitable than others. Payer mix, the penetration of managed care, and negotiated contracts as well as a number of other factors all have an impact on an individual hospital's margin. Surgeons should be fully cognizant of their significant influence in the marketplace.


Figures

None
FIGURE 1. Relative hospital margin (RHM) in margin units (mu) for FY03 and FY04 were calculated by the hospital finance department and reflect all actual collected revenue less all direct and indirect costs, normalized by the same constant for both years. The relative hospital margins for these 2 years were closely correlated with R2 = 0.88 (P < 0.001).
None
FIGURE 2. There is a significant positive correlation between relative hospital margin (RHM) (mu) and annual cumulative RVU for each surgical service, with R2 = 0.44 and P < 0.007. Quadrant boundaries reflect mean RHM and annual RVU for the clinical services, with mean RHM 381.238 mu and mean annual RVU 30,778. GIS, gastrointestinal surgery; TXP, liver, kidney, and pancreas transplant surgery; CRS, colorectal surgery; EOS, endocrine and oncologic surgery; ORL, otorhinolaryngology; TraumSCC, trauma and surgical critical care; GYN, gynecologic surgery; Ortho, orthopedic surgery department; OMFS, oral maxillofacial surgery department.
None
FIGURE 3. Relative hospital margin (RHM0 per RVU varies greatly by service. Mean RHM per RVU was 12.64 mu (standard deviation = 9.76 mu) with range from a loss of 0.57 mu per RVU (plastic surgery) to a gain of 34.55 mu per RVU (thoracic surgery). GIS, gastrointestinal surgery; TXP, liver, kidney, and pancreas transplant; CRS, colorectal surgery division; EOS, endocrine and oncologic surgery; ORL, otorhinolaryngology; TraumSC, trauma and surgical critical care; GYN, gynecologic surgery; Ortho, orthopedic surgery; OMFS, oral maxillofacial surgery.
None
FIGURE 4. Relative hospital margin per case is strongly correlated with relative value units per case with R2 = 0.76 and P < 0.0001. The mean RVU per case by clinical service was 24.49 (standard deviation = 12.88) with a range from 9.04 (urology) to 57.12 (transplant surgery). The mean relative hospital margin per case was 361.82 mu (standard deviation = 388.42 mu) with a range from a loss of 10.50 mu/case (plastic surgery) to a gain of 1435.18 mu/case (transplant surgery). GIS, gastrointestinal surgery; TXP, liver, kidney, and pancreas transplant; CRS, colorectal surgery division; EOS, endocrine and oncologic surgery; ORL, otorhinolaryngology; TraumSC, trauma and surgical critical care; GYN, gynecologic surgery; Ortho, orthopedic surgery; OMFS, oral maxillofacial surgery.
None
FIGURE 5. Relative hospital margin per OR HR is correlated with RVU per OR HR, but less so on a per-case basis, with R2 = 0.39 and P = 0.013. Mean RVU/OR HR was 7.10 (standard deviation = 1.56) with a range from 5.23/hr (otorhinolaryngology) to 10.97/hr (transplant surgery). Mean RHM/OR HR was 94.54 mu/hr (standard deviation = 81.56) with a range from a loss of 3.83 mu/hr (plastic surgery) to a gain of 275.74 mu/hr (transplant surgery). GIS, gastrointestinal surgery; TXP, liver, kidney, and pancreas transplant; CRS, colorectal surgery division; EOS, endocrine and oncologic surgery; ORL, otorhinolaryngology; TraumSC, trauma and surgical critical care; GYN, gynecologic surgery; Ortho, orthopedic surgery; OMFS, oral maxillofacial surgery.
None
FIGURE 6. Relative hospital margin has no correlation with total number of cases performed per year by each service (P < 0.05). Neurosurg, neurosurgery department; TXP, liver, kidney, and pancreas transplant; CRS, colorectal surgery division; EOS, endocrine and oncologic surgery; ORL, otorhinolaryngology; TraumSC, trauma and surgical critical care; GYN, gynecologic surgery; Ortho, orthopedic surgery; OMFS, oral maxillofacial surgery.
None
FIGURE 7. Relative hospital margin has no significant correlation with total annual OR hours used by each service (P < 0.05). Neurosurg, neurosurgery department; Cardiac, cardiac surgery division; GIS, gastrointestinal surgery division; TXP, liver, kidney, and pancreas transplant; CRS, colorectal surgery division; Thoracic, thoracic surgery division; Vascular, vascular surgery division; EOS, endocrine trauma and surgical critical care division; ORL, otorhinolaryngology; TraumSC, trauma and surgical critical care; GYN, gynecologic surgery; Urology, urology division; Plastics, plastic surgery division; Ortho, orthopedic surgery; OMFS, oral maxillofacial surgery department.

Comment in

References

    1. Todd BA, Resnick AS, Stuhlemmer R, et al. Challenges of the 80-hour resident work rules: collaboration between surgeons and nonphysician practitioners. Surg Clin North Am. 2004;84:1573–1586. - PubMed
    1. Huber TS, et al. Financial impact of tertiary care in an academic medical center. Ann Surg. 2000;231:860–868. - PMC - PubMed
    1. Taheri PA, Butz DA, Dechert R, et al. How DRGs hurt academic medical centers. J Am Coll Surg. 2001;193:1–11. - PubMed
    1. Taheri PA, Butz DA, Greenfield LJ. Paying a premium: how patient complexity affects costs and margin margins. Ann Surg. 1999;229:807–814. - PMC - PubMed
    1. 2004 National Physician Fee Schedule Relative Value File. Washington, DC: Centers for Medicare and Medicaid, Department of Health and Human Services; 2004.

Publication types