

Structure of a Mycobacterium tuberculosis NusA-RNA complex
- PMID: 16193062
- PMCID: PMC1276712
- DOI: 10.1038/sj.emboj.7600829
Structure of a Mycobacterium tuberculosis NusA-RNA complex
Abstract
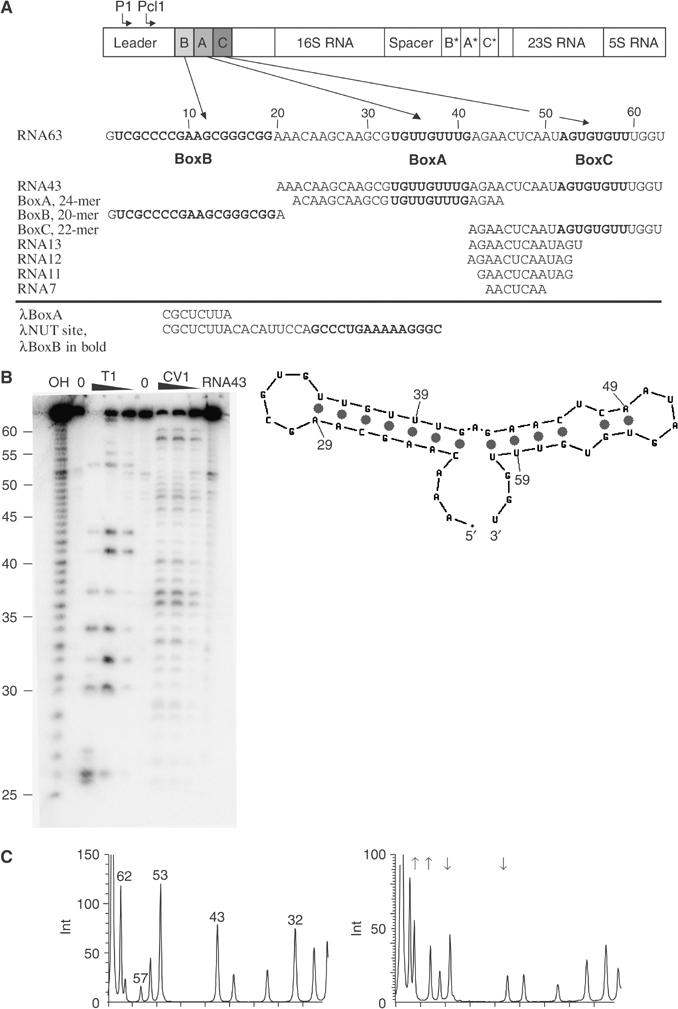
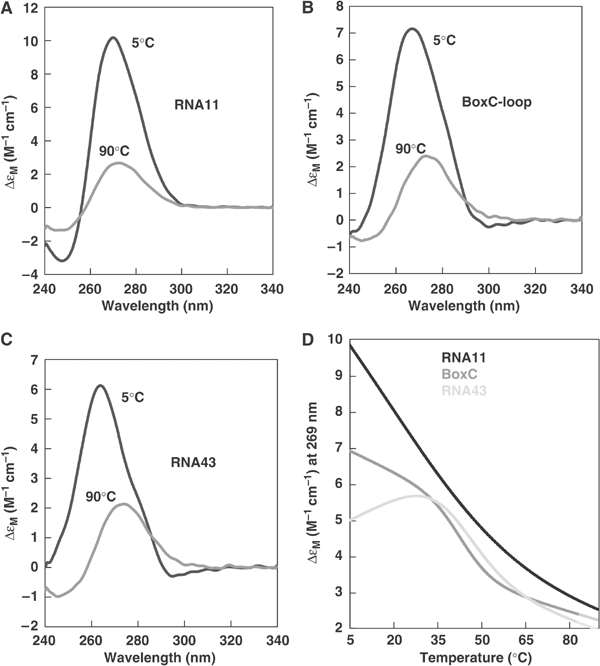
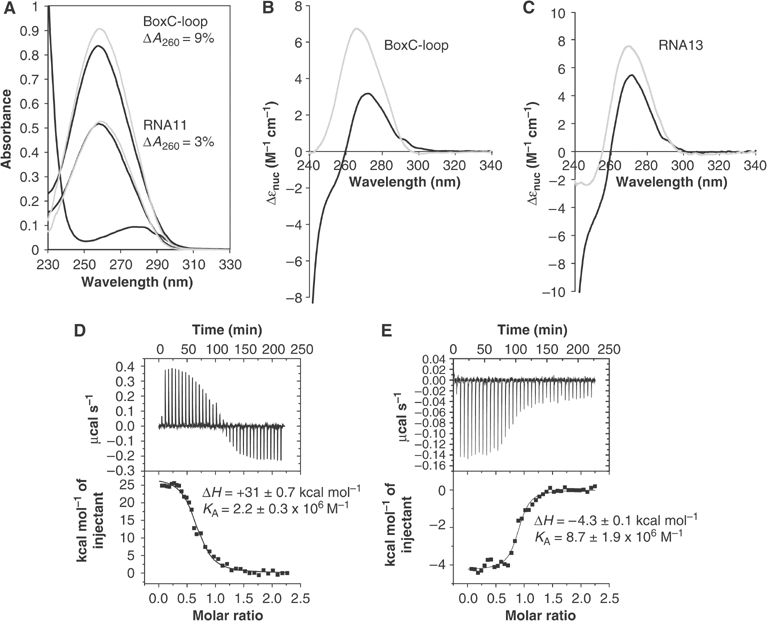
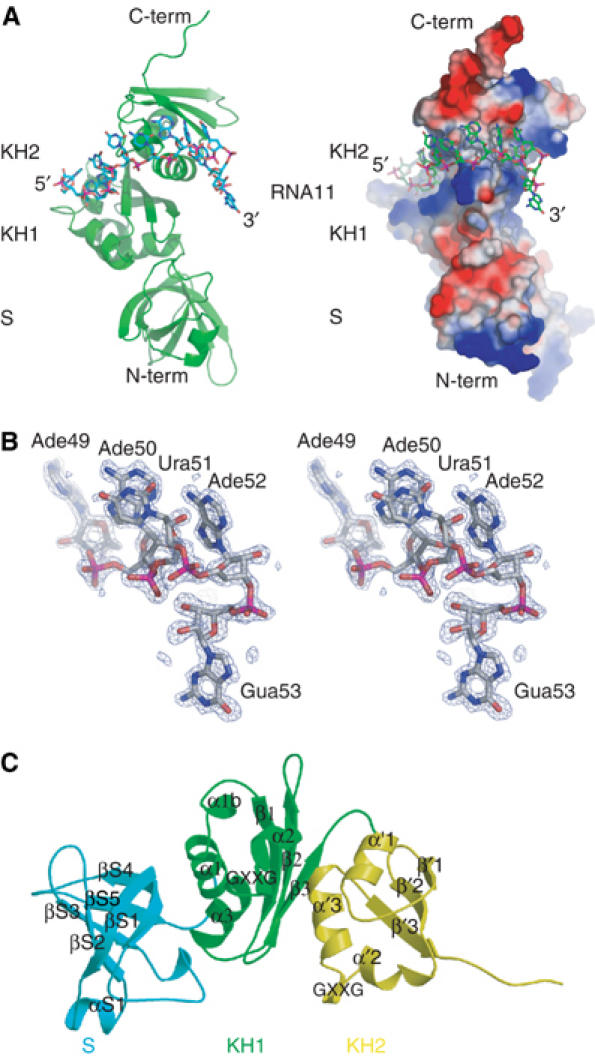
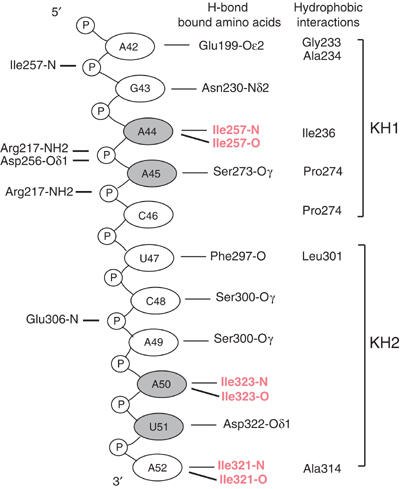
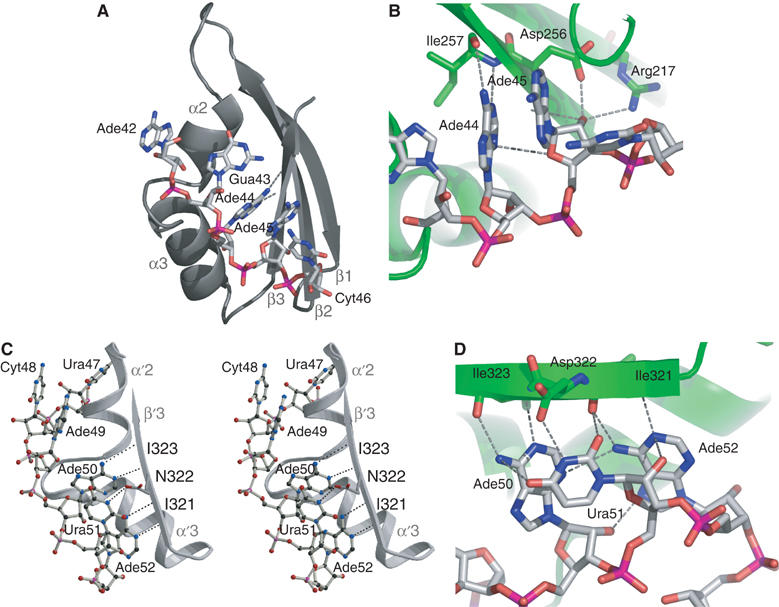
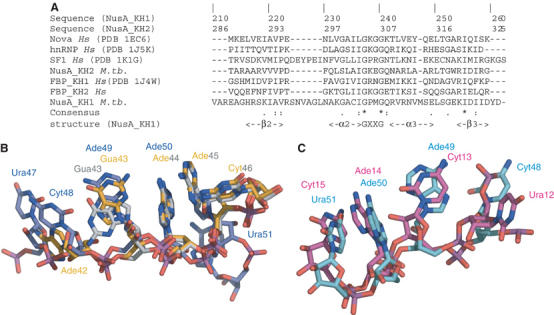
NusA is a key regulator of bacterial transcriptional elongation, pausing, termination and antitermination, yet relatively little is known about the molecular basis of its activity in these fundamental processes. In Mycobacterium tuberculosis, NusA has been shown to bind with high affinity and specificity to BoxB-BoxA-BoxC antitermination sequences within the leader region of the single ribosomal RNA (rRNA) operon. We have determined high-resolution X-ray structures of a complex of NusA with two short oligo-ribonucleotides derived from the BoxC stem-loop motif and have characterised the interaction of NusA with a variety of RNAs derived from the antitermination region. These structures reveal the RNA bound in an extended conformation to a large interacting surface on both KH domains. Combining structural data with observed spectral and calorimetric changes, we now show that NusA binding destabilises secondary structure within rRNA antitermination sequences and propose a model where NusA functions as a chaperone for nascently forming RNA structures.
Figures
Similar articles
-
A high-affinity interaction between NusA and the rrn nut site in Mycobacterium tuberculosis.Proc Natl Acad Sci U S A. 2004 Jun 1;101(22):8325-30. doi: 10.1073/pnas.0401287101. Epub 2004 May 24. Proc Natl Acad Sci U S A. 2004. PMID: 15159542 Free PMC article.
-
RNA-binding specificity of E. coli NusA.Nucleic Acids Res. 2009 Aug;37(14):4736-42. doi: 10.1093/nar/gkp452. Epub 2009 Jun 10. Nucleic Acids Res. 2009. PMID: 19515940 Free PMC article.
-
Crystal structure of the transcription elongation/anti-termination factor NusA from Mycobacterium tuberculosis at 1.7 A resolution.J Mol Biol. 2001 Dec 14;314(5):1087-95. doi: 10.1006/jmbi.2000.5144. J Mol Biol. 2001. PMID: 11743725
-
The interaction between RNA polymerase and the elongation factor NusA.RNA Biol. 2010 May-Jun;7(3):272-5. doi: 10.4161/rna.7.3.12021. Epub 2010 May 7. RNA Biol. 2010. PMID: 20458190 Review.
-
The bacterial transcription repair coupling factor.Curr Opin Struct Biol. 2007 Feb;17(1):96-102. doi: 10.1016/j.sbi.2007.01.005. Epub 2007 Jan 18. Curr Opin Struct Biol. 2007. PMID: 17239578 Free PMC article. Review.
Cited by
-
PdtaS Deficiency Affects Resistance of Mycobacteria to Ribosome Targeting Antibiotics.Front Microbiol. 2017 Nov 3;8:2145. doi: 10.3389/fmicb.2017.02145. eCollection 2017. Front Microbiol. 2017. PMID: 29163430 Free PMC article.
-
Evolutionary comparison of ribosomal operon antitermination function.J Bacteriol. 2008 Nov;190(21):7251-7. doi: 10.1128/JB.00760-08. Epub 2008 Aug 29. J Bacteriol. 2008. PMID: 18757535 Free PMC article.
-
Structural and functional analysis of the E. coli NusB-S10 transcription antitermination complex.Mol Cell. 2008 Dec 26;32(6):791-802. doi: 10.1016/j.molcel.2008.10.028. Mol Cell. 2008. PMID: 19111659 Free PMC article.
-
Crystal structure of human polynucleotide phosphorylase: insights into its domain function in RNA binding and degradation.Nucleic Acids Res. 2012 May;40(9):4146-57. doi: 10.1093/nar/gkr1281. Epub 2011 Dec 30. Nucleic Acids Res. 2012. PMID: 22210891 Free PMC article.
-
Sampling Native-like Structures of RNA-Protein Complexes through Rosetta Folding and Docking.Structure. 2019 Jan 2;27(1):140-151.e5. doi: 10.1016/j.str.2018.10.001. Epub 2018 Nov 8. Structure. 2019. PMID: 30416038 Free PMC article.
References
-
- Beltz H, Azoulay J, Bernacchi S, Clamme JP, Ficheux D, Roques B, Darlix JL, Mely Y (2003) Impact of the terminal bulges of HIV-1 cTAR DNA on its stability and the destabilizing activity of the nucleocapsid protein NCp7. J Mol Biol 328: 95–108 - PubMed
-
- Berg KL, Squires C, Squires CL (1989) Ribosomal RNA operon anti-termination. Function of leader and spacer region box B-box A sequences and their conservation in diverse micro-organisms. J Mol Biol 209: 345–358 - PubMed
MeSH terms
Substances
Associated data
- Actions
- Actions
LinkOut - more resources
Full Text Sources
Other Literature Sources
Molecular Biology Databases
