

Two-dimensional gas-phase separations coupled to mass spectrometry for analysis of complex mixtures
- PMID: 16194103
- PMCID: PMC1829301
- DOI: 10.1021/ac050871x
Two-dimensional gas-phase separations coupled to mass spectrometry for analysis of complex mixtures
Abstract
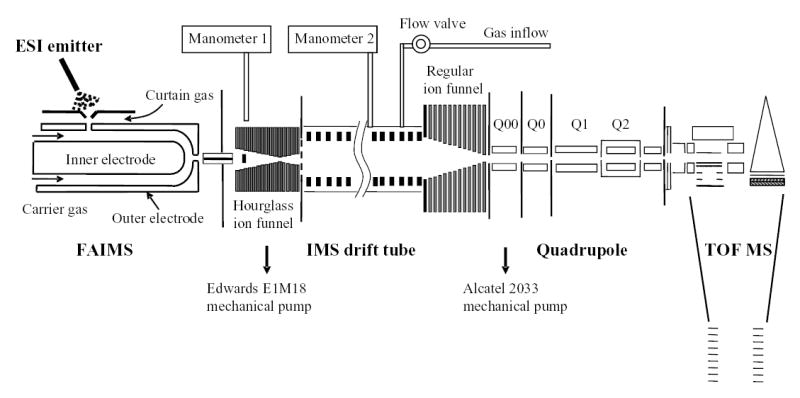
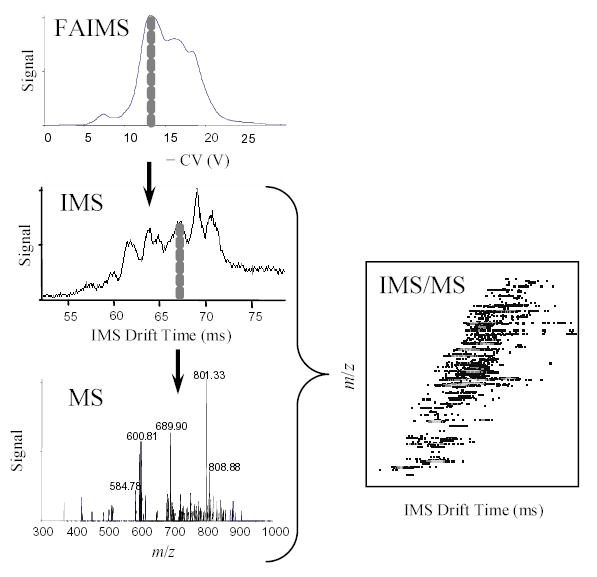
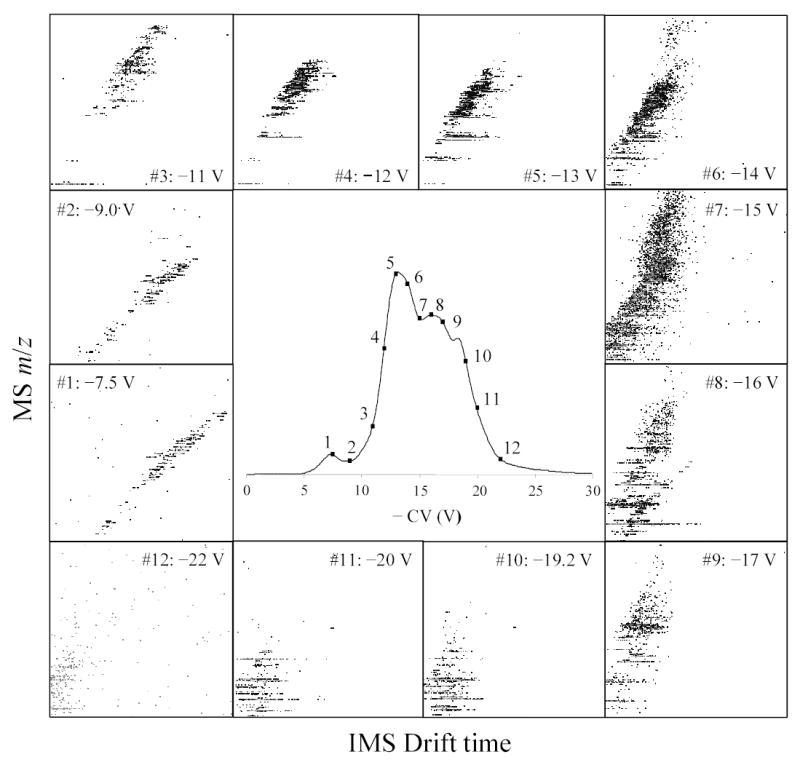
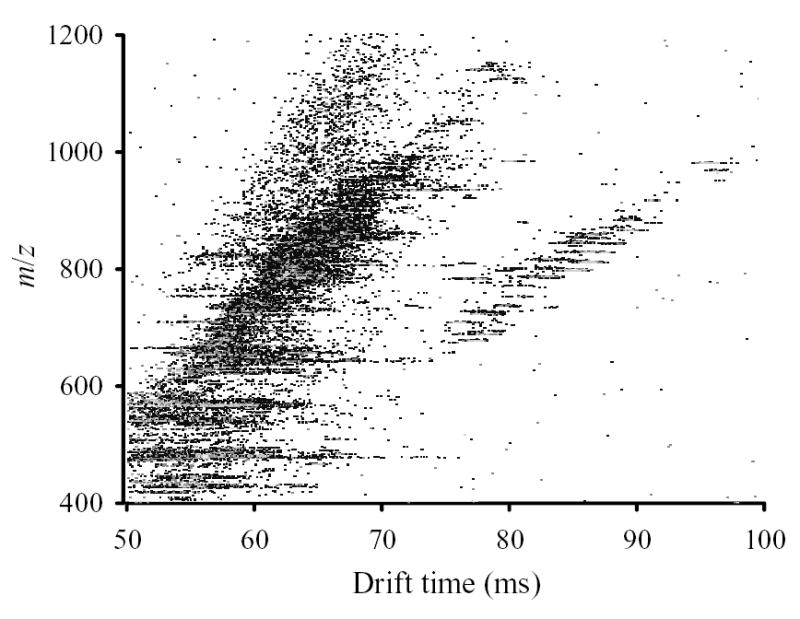
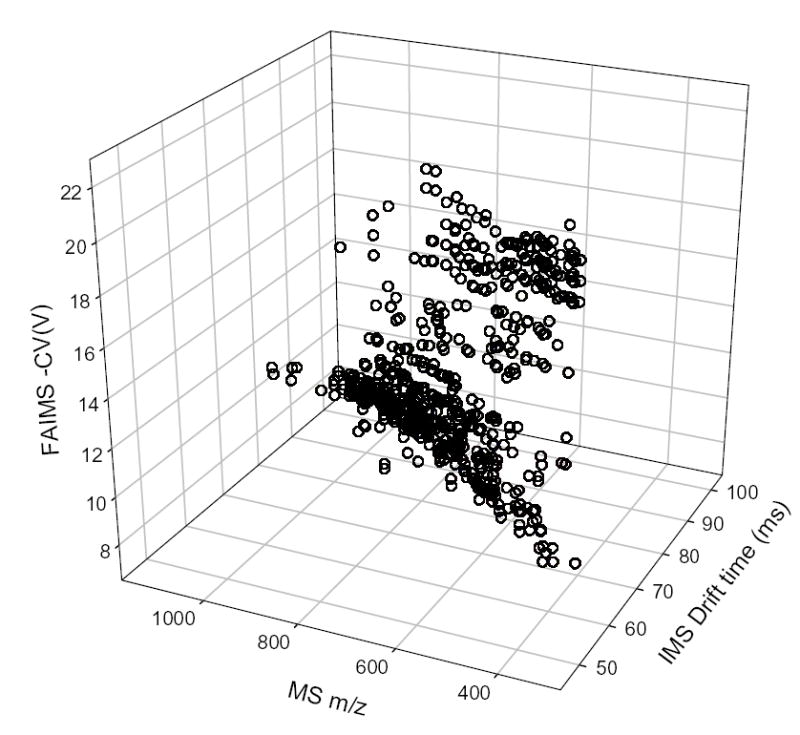
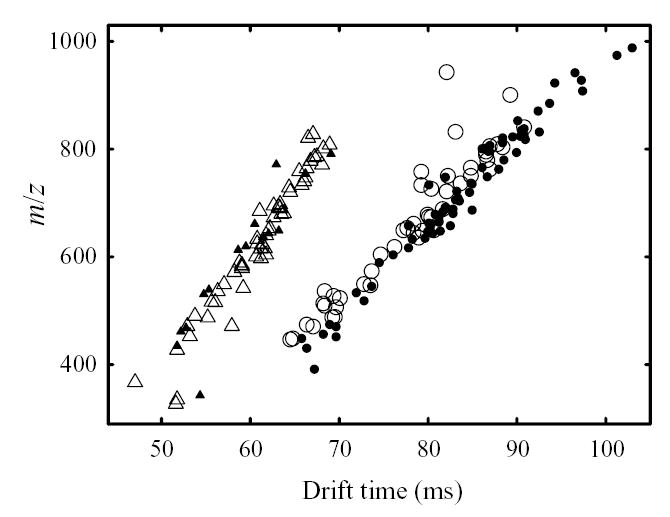
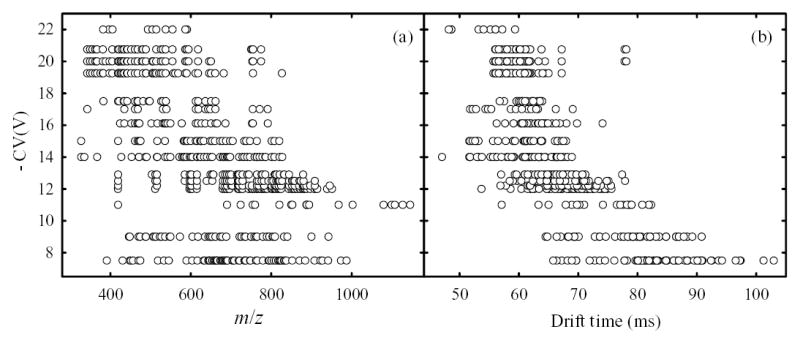
Ion mobility spectrometry (IMS) has been explored for decades, and its versatility in separation and identification of gas-phase ions is well established. Recently, field asymmetric waveform IMS (FAIMS) has been gaining acceptance in similar applications. Coupled to mass spectrometry (MS), both IMS and FAIMS have shown the potential for broad utility in proteomics and other biological analyses. A major attraction of these separations is extremely high speed, exceeding that of condensed-phase alternatives by orders of magnitude. However, modest separation peak capacities have limited the utility of FAIMS and IMS for analyses of complex mixtures. We report 2-D gas-phase separations that join FAIMS to IMS, in conjunction with high-resolution and accuracy time-of-flight (TOF) MS. Implementation of FAIMS/IMS and IMS/MS interfaces using electrodynamic ion funnels greatly improves sensitivity. Evaluation of FAIMS/IMS/TOF performance for a protein mixture tryptic digest reveals high orthogonality between FAIMS and IMS dimensions and, hence, the benefit of FAIMS filtering prior to IMS/MS. The effective peak capacities in analyses of tryptic peptides are approximately 500 for FAIMS/IMS separations and approximately 10(6) for 3-D FAIMS/IMS/MS, providing a potential platform for ultrahigh-throughput analyses of complex mixtures.
Figures
Similar articles
-
High-resolution differential ion mobility separations using helium-rich gases.Anal Chem. 2010 Mar 15;82(6):2456-62. doi: 10.1021/ac902852a. Anal Chem. 2010. PMID: 20151640 Free PMC article.
-
Two-dimensional ion mobility analyses of proteins and peptides.Methods Mol Biol. 2009;492:417-45. doi: 10.1007/978-1-59745-493-3_26. Methods Mol Biol. 2009. PMID: 19241049
-
Multiplexed ion mobility spectrometry-orthogonal time-of-flight mass spectrometry.Anal Chem. 2007 Mar 15;79(6):2451-62. doi: 10.1021/ac0617316. Epub 2007 Feb 17. Anal Chem. 2007. PMID: 17305309 Free PMC article.
-
High-field asymmetric waveform ion mobility spectrometry for mass spectrometry-based proteomics.Expert Rev Proteomics. 2012 Oct;9(5):505-17. doi: 10.1586/epr.12.50. Expert Rev Proteomics. 2012. PMID: 23194268 Free PMC article. Review.
-
Coupling Front-End Separations, Ion Mobility Spectrometry, and Mass Spectrometry For Enhanced Multidimensional Biological and Environmental Analyses.Annu Rev Anal Chem (Palo Alto Calif). 2017 Jun 12;10(1):71-92. doi: 10.1146/annurev-anchem-061516-045212. Epub 2017 Feb 23. Annu Rev Anal Chem (Palo Alto Calif). 2017. PMID: 28301728 Free PMC article. Review.
Cited by
-
Tandem-trapped ion mobility spectrometry/mass spectrometry (tTIMS/MS): a promising analytical method for investigating heterogenous samples.Analyst. 2022 May 30;147(11):2317-2337. doi: 10.1039/d2an00335j. Analyst. 2022. PMID: 35521797 Free PMC article. Review.
-
Characterization of a temperature-controlled FAIMS system.J Am Soc Mass Spectrom. 2007 Sep;18(9):1653-63. doi: 10.1016/j.jasms.2007.06.009. Epub 2007 Jun 22. J Am Soc Mass Spectrom. 2007. PMID: 17662612
-
Improving the efficiency of IMS-IMS by a combing technique.Anal Chem. 2008 Mar 15;80(6):1918-27. doi: 10.1021/ac7018602. Epub 2008 Feb 22. Anal Chem. 2008. PMID: 18290667 Free PMC article.
-
Collisional Cross-Sections with T-Wave Ion Mobility Spectrometry without Experimental Calibration.J Am Soc Mass Spectrom. 2017 Jul;28(7):1282-1292. doi: 10.1007/s13361-017-1669-0. Epub 2017 Apr 21. J Am Soc Mass Spectrom. 2017. PMID: 28432656
-
Ultrafast differential ion mobility spectrometry at extreme electric fields coupled to mass spectrometry.Anal Chem. 2009 Oct 1;81(19):8048-53. doi: 10.1021/ac901479e. Anal Chem. 2009. PMID: 19708673 Free PMC article.
References
-
- Aebersold R, Mann M. Nature. 2003;422:198. - PubMed
-
- Shen Y, Zhao R, Berger SJ, Anderson GA, Rodriguez N, Smith RD. Anal Chem. 2002;74:4235. - PubMed
-
- Shen Y, Xiang F, Veenstra TD, Fung EN, Smith RD. Anal Chem. 1999;71:5348. - PubMed
-
- Shevchenko A, Wilm M, Vorm O, Mann M. Anal Chem. 1996;68:850. - PubMed
Publication types
MeSH terms
Substances
Grants and funding
LinkOut - more resources
Full Text Sources
Other Literature Sources
