. 2005 Oct 1;77(19):6435-44.
doi: 10.1021/ac0509354.

Determination of complex isotopomer patterns in isotopically labeled compounds by mass spectrometry

Affiliations

Determination of complex isotopomer patterns in isotopically labeled compounds by mass spectrometry

Mark E Jennings 2nd et al. Anal Chem. .

Abstract

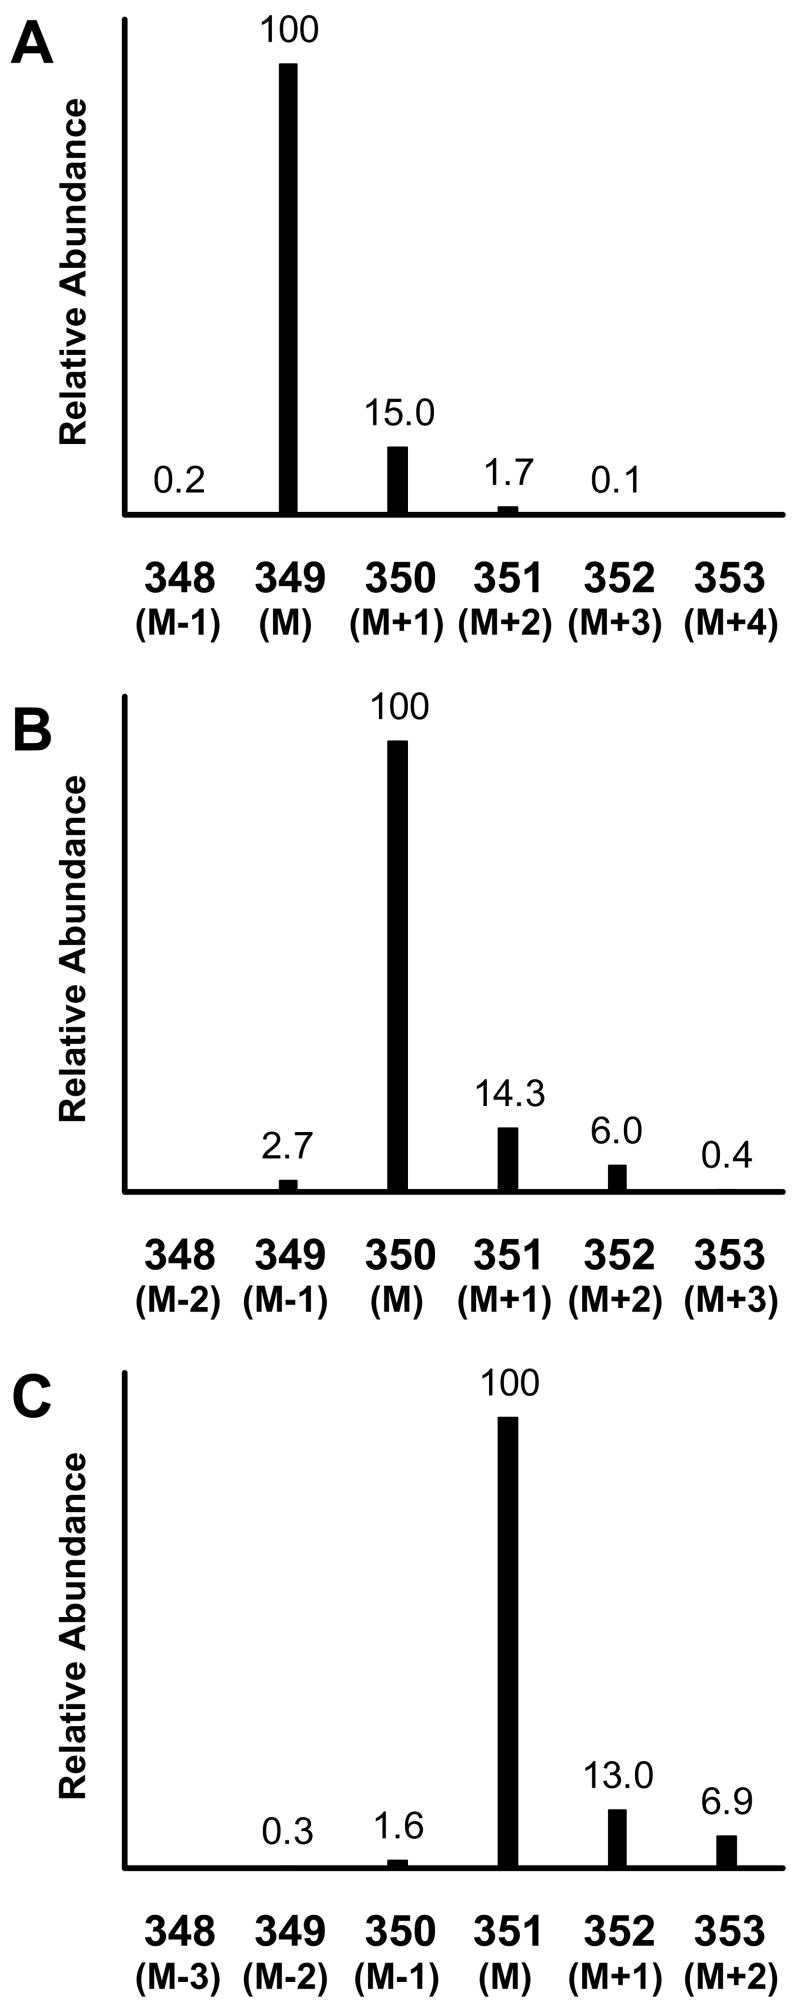
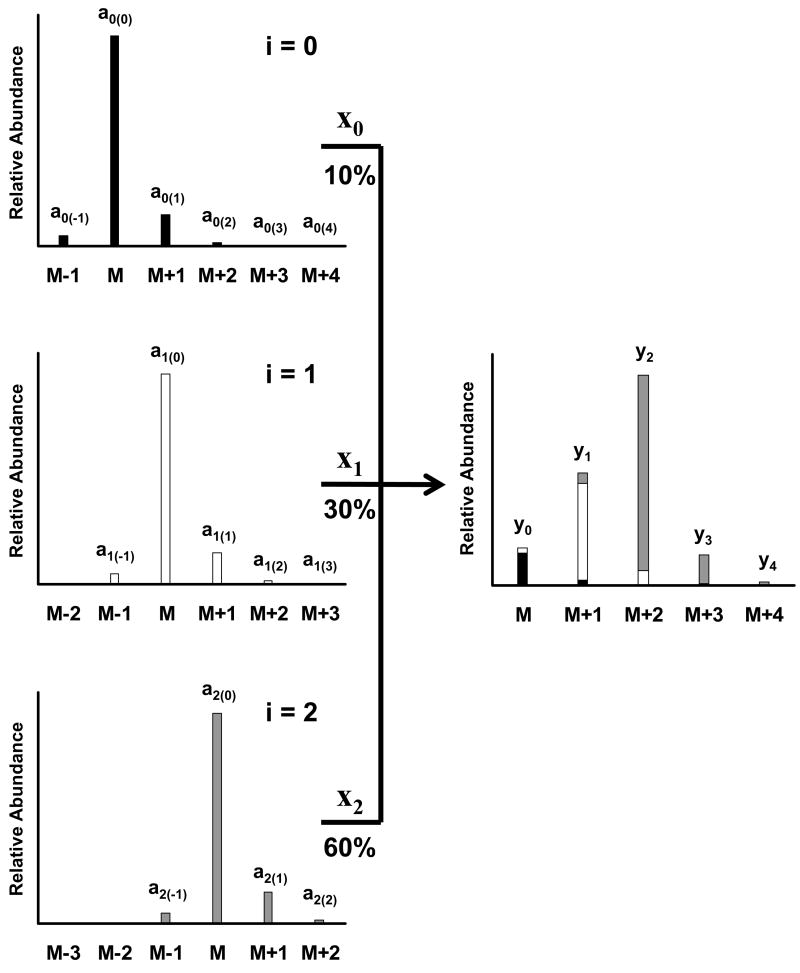
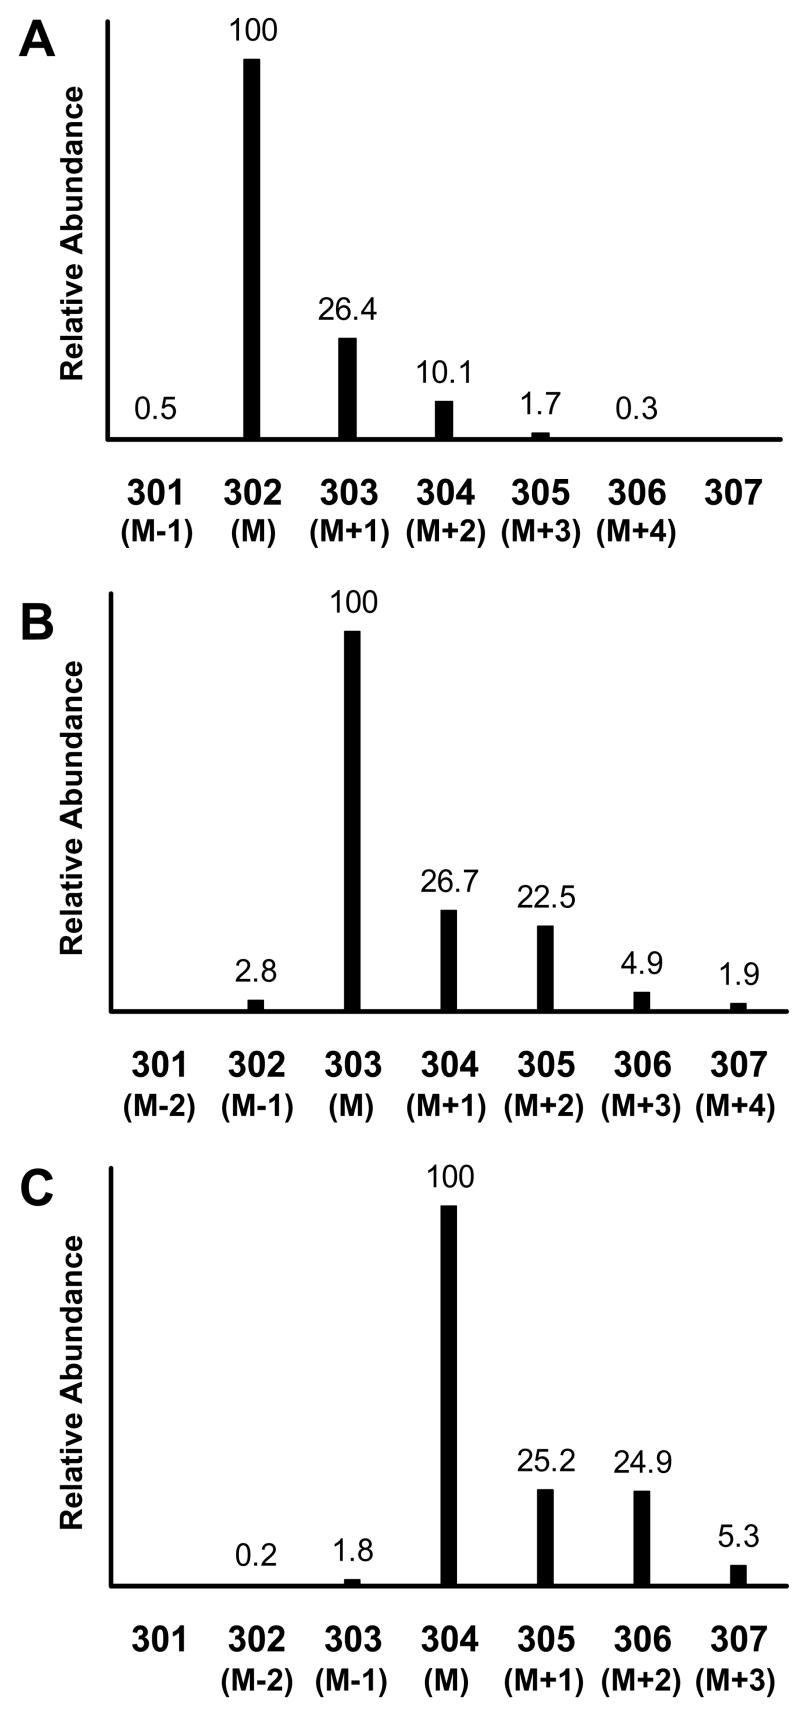
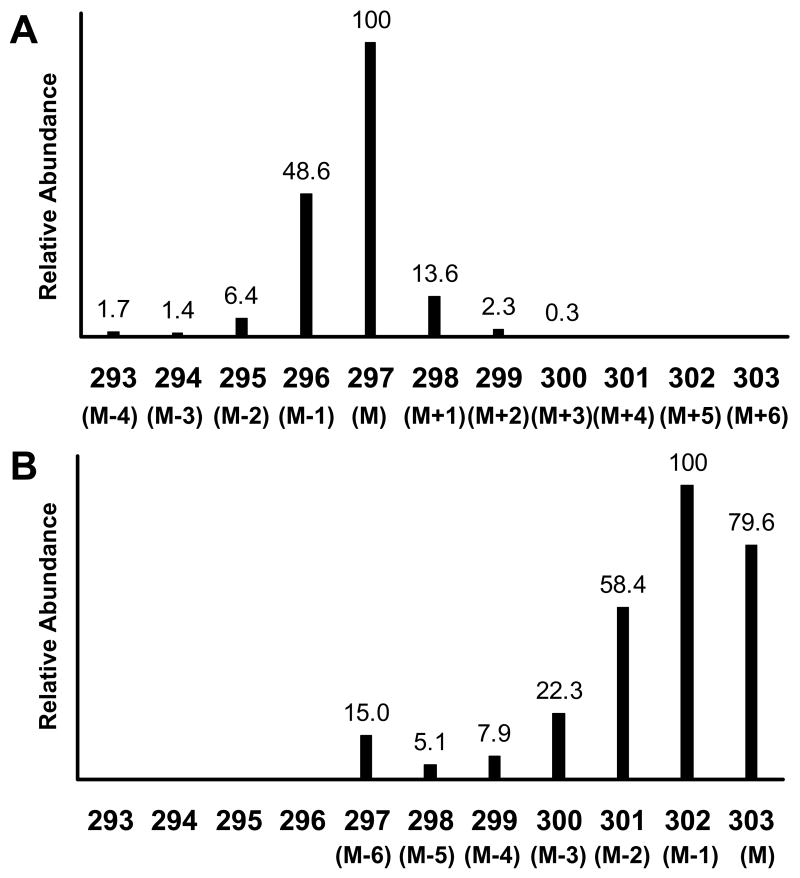
A classic problem in analytical chemistry has been determination of individual components in a mixture without availability of the pure individual components. Measurement of the distribution of isotopomers in a labeled compound or mixture of labeled compounds is an example of this problem that is commonly encountered when stable isotopically labeled metabolites are used to determine in vivo kinetics and metabolism. We present a method that uses the measured mass spectral data of the unlabeled material to represent any and all combinations of isotopomer variations of that material and to determine abundances of these isotopomers. Although examples of the method are presented for gas chromatography/mass spectrometry, the method is applicable to any type of mass spectrometry data. The method also accounts for errors induced by mass spectrometer ionization and resolution effects. To demonstrate this method, we determined the isotopomer distributions of samples of 13C-labeled leucine and glucose for both highly enriched isotopomers and labeled isotopomers present in low abundance against a natural isotopic abundance background. The method accurately and precisely determined isotopomer identity and abundance in the labeled materials without adding noise or error that was not inherent in the original mass spectral data. In examples shown here, isotopomer uncertainties were calculated with relative standard errors of <1% from good quality mass spectral data.


Figures

Figure 1
Figure 1
Mass spectra of the N-heptafluorobutyryl, n-propyl derivative of unlabeled leucine (panel A), [1-13C]leucine (panel B), and [1,2-13C2]leucine (panel C) obtained by negative chemical ionization GCMS. The presented spectra are focused on the [M-HF] ion and its naturally occurring isotope ions for each compound. Intensities are shown as relative abundance for each ion relative to the base mass M of each isotopomer. The numerical values for the x-axis are the measured m/z values. The figure represents data obtained from Experiment 1.
Figure 2
Figure 2
Theoretical representation of a mixture of three isotopomers of a single compound. The left side spectra show the individual spectra for the pure labeled isotopomers: unlabeled (top panel, solid bars), singly (middle panel, open bars), and doubly labeled (bottom panel, gray bars) isotopomers. Intensities are shown as relative abundance for each ion relative to the base mass M of each isotopomer’s spectrum. The right side panel shows the mixture of all three isotopomers. The contributing components of each isotopomer are shown by the different shading of the bars. The mixture is composed of 10% unlabeled material, 30% singly labeled isotopomer, and 60% doubly labeled isotopomer. Each isotopomer is designated by a value of i, where i = 0, 1, and 2 for the unlabeled, singly, and doubly labeled isotopomers, respectively. The relative abundance of each ion in each individual isotopomer’s spectrum is designated by ai(j), where j is the mass difference from the base mass, M, for each isotopomer, i. The value xi defines the fractional abundance for each isotopomer in the mixture on the right. The relative abundance of each ion in the mixture is represented by values of yj. For the mixture, M is indexed to the base mass of the unlabeled isotopomer.
Figure 3
Figure 3
Mass spectra of the t-butyldimethylsilyl derivative of unlabeled leucine (panel A), [1-13C]leucine (panel B), and [1,2-13C2]leucine (panel C) obtained by electron impact ionization GCMS. The presented spectra are focused on the [M-57]+ ion (defined as M for each isotopomer) and its naturally occurring isotope ions for each isotopomer. Intensities are shown as relative abundance for each ion relative to the base mass M of each isotopomer. The numerical values for the x-axis are the measured m/z values. The figure represents the data obtained from Experiment 1.
Figure 4
Figure 4
Mass spectra of the bis-butylboronate acetyl derivative of unlabeled (panel A) and [U-13C]glucose (panel B) obtained by electron impact ionization GCMS. The presented spectra are focused on the [M-57]+ ion (defined as M for each isotopomer) and its naturally occurring isotope ions for each isotopomer. Intensities are shown as relative abundance for each ion relative to the base mass M of each isotopomer. The numerical values for the x-axis are the measured m/z values. The figure represents the data obtained from Experiment 3.

References

    1. Biemann K. Mass Spectrometry: Organic Chemical Applications. McGraw-Hill; New York: 1962.
    1. Tserng KY, Kalhan SC. Am J Physiol Endocrinol Metab. 1983;245:E308–E311. - PubMed
    1. Rosenblatt J, Chinkes D, Wolfe M, Wolfe RR. Am J Physiol Endocrinol Metab. 1992;263:E584–E596. - PubMed
    1. Lee WNP, Whiting JS, Fymat AL, Boettger HG. Biol Mass Spectrom. 1983;10:641–45.
    1. Lee WNP. J Biol Chem. 1989;264:13002–04.

Publication types