. 2005 Sep 30:6:240.
doi: 10.1186/1471-2105-6-240.

Sequence variation in ligand binding sites in proteins

Affiliations

Sequence variation in ligand binding sites in proteins

Thomas J Magliery et al. BMC Bioinformatics. .

Abstract

Background: The recent explosion in the availability of complete genome sequences has led to the cataloging of tens of thousands of new proteins and putative proteins. Many of these proteins can be structurally or functionally categorized from sequence conservation alone. In contrast, little attention has been given to the meaning of poorly-conserved sites in families of proteins, which are typically assumed to be of little structural or functional importance.

Results: Recently, using statistical free energy analysis of tetratricopeptide repeat (TPR) domains, we observed that positions in contact with peptide ligands are more variable than surface positions in general. Here we show that statistical analysis of TPRs, ankyrin repeats, Cys2His2 zinc fingers and PDZ domains accurately identifies specificity-determining positions by their sequence variation. Sequence variation is measured as deviation from a neutral reference state, and we present probabilistic and information theory formalisms that improve upon recently suggested methods such as statistical free energies and sequence entropies.

Conclusion: Sequence variation has been used to identify functionally-important residues in four selected protein families. With TPRs and ankyrin repeats, protein families that bind highly diverse ligands, the effect is so pronounced that sequence "hypervariation" alone can be used to predict ligand binding sites.


Figures
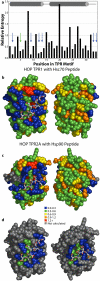
Figure 1
Figure 1
Relative entropy analysis of 6,887 canonical-length (34 aa) TPR repeats. (a) The relative entropy values are shown for each TPR position, with secondary structure indicated (cylinders represent helices and lines represent loops). Arrows indicate the positions of the seven most variable residues. These values are mapped onto the co-crystal structures of HOP-TPR1/Hsc70 peptide (b) and HOP-TPR2A/Hsp90 peptide (c), with the TPR domains rendered in spheres and the ligands in sticks. Two views from 180° rotation of each molecule are shown. The concave, ligand binding surfaces, left, are clearly more variable than the convex, solvent exposed surfaces, right. A small insertion in TPR2A is colored grey. (d) Views of the concave binding surfaces as in (c), but only those residues known to contact the ligand from co-crystal structures are colored [19]. Rendered from PDB entries 1ELW and 1ELR using PyMOL.
Figure 2
Figure 2
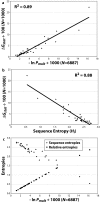
Measuring differences in distributions. (a) Lockless & Ranganathan statistical free energies versus the logarithm of the multinomial probability for each of the 34 sites in TPRs. (b) Relationship of SFEs to sequence (Shannon) entropy for TPR sites. (c) Relationship of logarithm of multinomial probabilities to sequence entropy (circles) and relative entropy (squares).
Figure 3
Figure 3
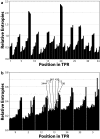
Effects of sample size. (a) Average relative entropy associated with each of the 34 positions in TPRs with random subsets of various sizes. Each cluster of bars represents one position in the TPR motif. The cluster is composed of bars, left to right, from sets with approximately 6887, 3444, 1722, 861, 430, 215 and 108 sequences. Each bar is the average of five subsets of the same size (except 6887, since there is only one set this size – all sequences). (b) Relative entropies associated with five randomly chosen subsets of various sizes for the seven positions most like the reference state. Each cluster of bars represents one position. The individual bars show the calculated relative entropies for subsets of the same sizes as in (a) (five of each size).
Figure 4
Figure 4
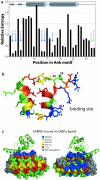
Relative entropy analysis of canonical positions in 15,497 Ank repeats. (a) The positional relative entropies are shown with secondary structural elements noted (grey arrows are β-strands). Blue and green arrows indicate the most variable positions; asterisks (*) indicate positions mutated by the Plückthun lab to alter Ank-domain specificity. (b) The location of the binding site in a single Ank repeat in the loop and proximal α-helical surface is labeled. (c) The 4-Ank domain from GABPβ1 (spheres) is shown bound to the ligand GABPα (ribbons) in two views from 180° rotation. Again, the binding surface is evident from the low relative entropies. Note that some non-binding surface-exposed positions, particularly turn residues, are conserved due to their importance in defining the Ank fold. Some positions in GABPβ1 do not map onto the canonical Ank sequence and are colored grey. Rendered using PyMOL from PDB entry 1AWC.
Figure 5
Figure 5
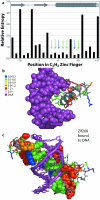
Relative entropy analysis of canonical positions in 28,442 C2H2 zinc fingers. (a) Positions in the graph are shown in the order found in Pfam and numbered by convention (where -1 is the residue N-terminal to the α-helix). Note that the y-axis scale is different from Figs. 1 and 2 due to the almost invariant zinc(II)-binding residues (-10, -7, +7 and +11). Blue and green arrows indicate the seven predicted specificity-determining positions. (b) The middle zinc finger of Zif268 bound to DNA (purple) is shown, with the Zn(II) atom as a pink sphere [43]. (c) The residues in contact with the DNA from all three zinc fingers of Zif268 are rendered in spheres. The DNA-binding positions group into variable, specificity-determining positions (blue and green spheres) projecting into the major groove of the DNA, and conserved positions that enhance affinity to DNA but do not affect specificity (orange and red spheres). Rendered with PyMOL from PDB entry 1A1I.
Figure 6
Figure 6
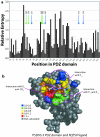
Relative entropy analysis of canonical positions in 2,751 PDZ domains. (a) Positions in the graph are shown in the order found in Pfam and with the same numbering. Only positions with greater than 50% occupancy were calculated. The eight variable binding positions are marked with arrows, and the corresponding residue number in PSD95-3 is listed. (b) The structure of PSD95-3 with its cognate ligand peptide, KQTSV [44]. Note that atoms are missing from the ligand lysine sidechain due to lack of electron density in the X-ray data. The structurally-determined binding residues (see text) are colored, and the eight predicted specificity-determining positions are labeled with residue numbers as in (a). Rendered with PyMOL from PDB entry 1BE9.

References

    1. Teichmann SA, Murzin AG, Chothia C. Determination of protein function, evolution and interactions by structural genomics. Current Opinion in Structural Biology. 2001;11:354–363. doi: 10.1016/S0959-440X(00)00215-3. - DOI - PubMed
    1. Thornton JM. From genome to function. Science. 2001;292:2095–2097. doi: 10.1126/science.292.5524.2095. - DOI - PubMed
    1. Gough J, Karplus K, Hughey R, Chothia C. Assignment of homology to genome sequences using a library of hidden Markov models that represent all proteins of known structure. Journal of Molecular Biology. 2001;313:903–919. doi: 10.1006/jmbi.2001.5080. - DOI - PubMed
    1. Bork P, Koonin EV. Protein sequence motifs. Current Opinion in Structural Biology. 1996;6:366–376. doi: 10.1016/S0959-440X(96)80057-1. - DOI - PubMed
    1. Whisstock JC, Lesk AM. Prediction of protein function from protein sequence and structure. Quarterly Review of Biophysics. 2003;36:307–340. doi: 10.1017/S0033583503003901. - DOI - PubMed

Publication types

MeSH terms

LinkOut - more resources