. 2005 Dec;16(12):5563-71.
doi: 10.1091/mbc.e05-08-0756. Epub 2005 Sep 29.

Temperature-modulated alternative splicing and promoter use in the Circadian clock gene frequency

Affiliations

Temperature-modulated alternative splicing and promoter use in the Circadian clock gene frequency

Hildur V Colot et al. Mol Biol Cell. 2005 Dec.

Abstract

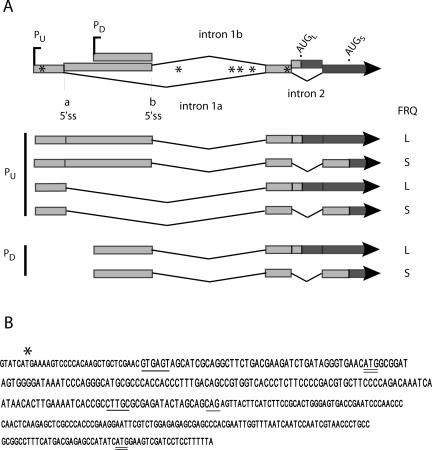
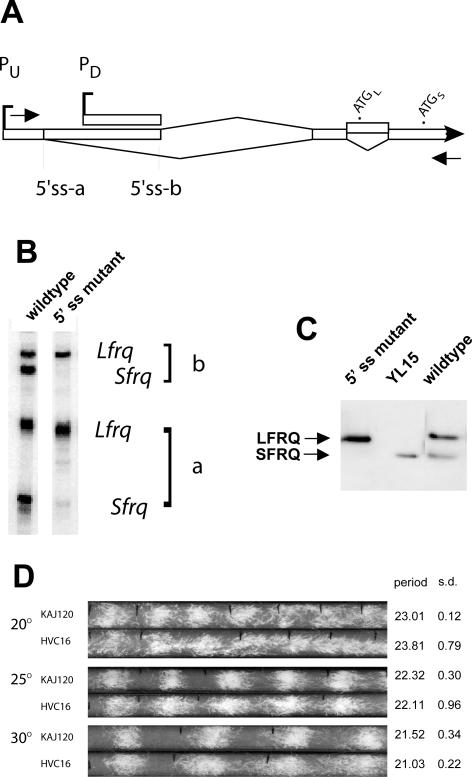
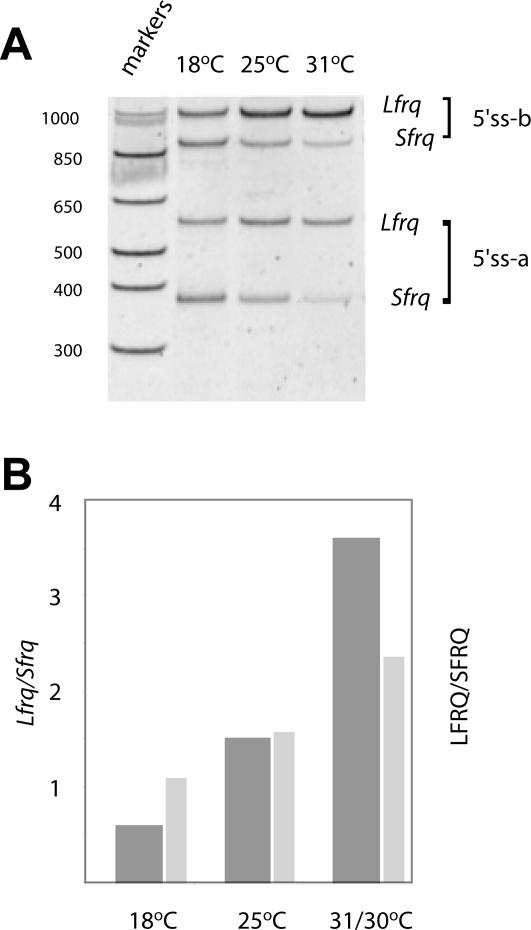
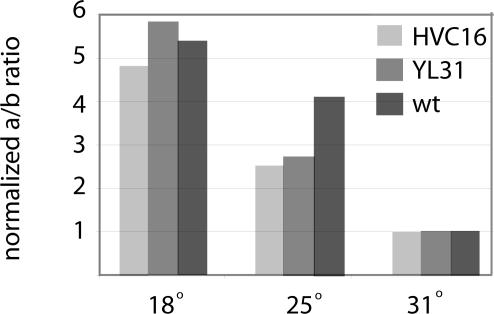
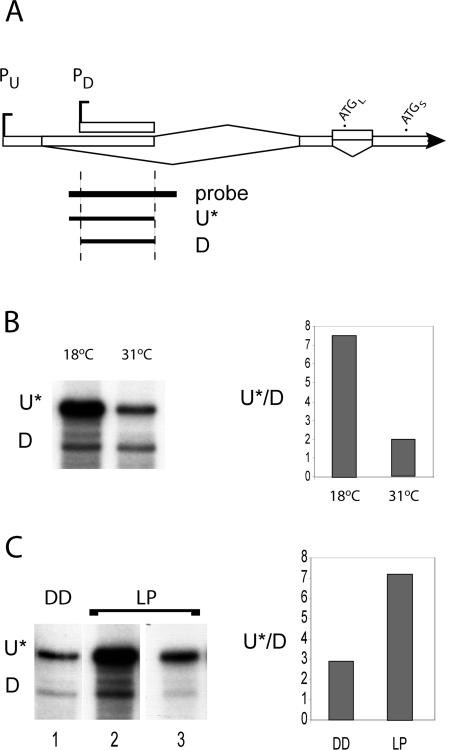
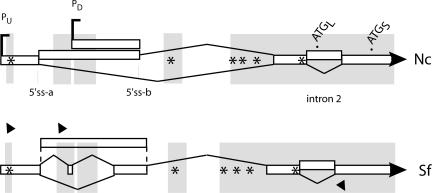
The expression of FREQUENCY, a central component of the circadian clock in Neurospora crassa, shows daily cycles that are exquisitely sensitive to the environment. Two forms of FRQ that differ in length by 99 amino acids, LFRQ and SFRQ, are synthesized from alternative initiation codons and the change in their ratio as a function of temperature contributes to robust rhythmicity across a range of temperatures. We have found frq expression to be surprisingly complex, despite our earlier prediction of a simple transcription unit based on limited cDNA sequencing. Two distinct environmentally regulated major promoters drive primary transcripts whose environmentally influenced alternative splicing gives rise to six different major mRNA species as well as minor forms. Temperature-sensitive alternative splicing determines AUG choice and, as a consequence, the ratio of LFRQ to SFRQ. Four of the six upstream ORFs are spliced out of the vast majority of frq mRNA species. Alternative splice site choice in the 5' UTR and relative use of two major promoters are also influenced by temperature, and the two promoters are differentially regulated by light. Evolutionary comparisons with the Sordariaceae reveal conservation of 5' UTR sequences, as well as significant conservation of the alternative splicing events, supporting their relevance to proper regulation of clock function.


Figures

Figure 1.
Figure 1.
Schematic of frq transcript structure. (A) This diagram is a compilation of the results from many experiments (see below), and represents the first ca. 1900 nt of the transcribed region of frq. The alternative start sites are designated PU and PD. The broad Vs represent introns. Alternative 5′ splice sites for the large upstream intronic region are called a and b. Intron 2 encompasses AUGL, as shown. The asterisks (*) represent upstream AUGs. The lighter shading indicates exon sequences, which vary among the transcripts, and the darker shading denotes coding sequences. (B) The sequence of intron 2 and adjacent regions is shown. Consensus sequences for splicing are underlined; the 5′ and 3′ splice sites were determined experimentally, but the branchpoint sequence shown, CTTGC, is the closest match to the known consensus for Neurospora (see Results). Initiation codons for LFRQ and SFRQ are doubly underlined, and the ATG for uORF 6 is indicated by an asterisk.
Figure 2.
Figure 2.
Splicing of intron 2 is necessary for translation to initiate at AUGS. (A) Schematic of the 5′ end of frq (see Figure 1) with primers for RT-PCR indicated by arrows. (B) RT-PCR products amplified from total RNA from a wild-type strain and a frq10 strain transformed with a frq construct (pHVC16) in which the 5′ splice site for intron 2 has been mutated (see text). The four bands correspond to the top four transcripts depicted in Figure 1; this primer pair would not amplify transcripts coming from PD. Note the absence of the bands (Sfrq) in the 5′ss mutant lane that correspond to splicing of intron 2; the two remaining bands reflect the use of alternative 5′ splice sites a and b in the large 5′ UTR intronic region, respectively. (C) Western analysis of FRQ protein made in three strains: wild-type, HVC16, and YL15 (a strain bearing a deletion of five uORFs, as well as AUGL, which makes only SFRQ; Liu et al., 1997). The 5′ splice site mutant protein shown was prepared from tissue grown at 30°C, but other temperatures give a similar pattern with lower expression. The other strains were grown at 25°C; all were harvested 16 h after transfer to darkness (DD16), in the subjective morning. The extracts were treated with lambda protein phosphatase before analysis to allow clear visualization of SFRQ and LFRQ (Garceau et al., 1997). (D) Race tube analysis of strain HVC16 compared with KAJ120 (a transformant bearing a complete wild-type copy of frq and surrounding sequences; Liu et al., 1997) at three temperatures. The average periods and SDs are shown on the right (n = 6).
Figure 3.
Figure 3.
Levels of alternatively spliced products reflect the ambient temperature. (A) The gel shows RT-PCR products amplified from total RNA of strains grown at 18, 25, and 31°C in constant light (LL); the DNA was stained with VistraGreen and visualized on a Storm PhosphorImager. The primers and products are as in Figure 2. (B) The graph compares the ratios of the transcripts (dark bars), as determined from quantitation of the gel in A, with the ratios of the protein (light bars; Liu et al., 1997) at three temperatures. The absolute values of the ratios vary somewhat from experiment to experiment but their relationships are always similar to the representative sample shown here. Preliminary experiments were performed to determine conditions under which the RT-PCR was linear (unpublished data). Quantitative estimates are based on comparisons of bands obtained within each sample and not between samples.
Figure 4.
Figure 4.
Choice of 5′ splice site for alternative splicing in the 5′ UTR is thermosensitive. Real-time RT-PCR was used to compare the ratios of Ua to Ub transcripts at different temperatures (see Materials and Methods). Ua/Ub at 31°C was set to 1. The three degrees of shading represent RNA from three different strains, all grown in LL for 22–24 h at the indicated temperatures: light gray is HVC16, the intron-2 5′ splice site mutant; medium gray is YL31 (Liu et al., 1997), which has mutations in AUGL and AUGS and makes an untranslatable frq transcript; and dark gray is wild-type.
Figure 5.
Figure 5.
The two major promoters respond differentially to light and temperature. (A) Schematic of the frq 5′ end showing the probe used for ribonuclease protection assay (RPA) and expected protected products corresponding to transcripts from the two promoters, PU and PD. The probe is 455 nt long and would protect fragments of 300 (D, for PD) and 350 (U*, for PU*) nt. Note that the U* fragment represents only a fraction of the transcripts transcribed from the upstream start site PU, due to alternative splicing (see text). (B) Denaturing gels and quantitation by PhosphorImager of fragments protected in the RPA assay. RNA was made from a wild-type strain grown at the indicated temperatures in DD and collected at DD16 (for 18°C) or DD13 (for 31°C). Total RNA, 30 μg, was used for both samples. (C) RNA was made from a wild-type strain grown in constant darkness (DD) at 25°C for 22 h and subjected to a 5-min light pulse (LP) followed by 15 min in DD before harvesting. Ten micrograms of the LP sample and 30 μg of the DD control sample were used in the assay. Lanes 1 and 2 were exposed to the PhosphorImager screen for 3 d; lane 3 was exposed overnight. The quantitation is based on the gels shown, which are representative of four independent replications.
Figure 6.
Figure 6.
Schematics of the structures of Neurospora and Sordaria frq transcripts. The symbols are the same as in Figure 1. The overall length of the region is slightly shorter in Sordaria, but RT-PCR analyses followed by sequencing of the products revealed a similar array of alternative splicing events. Primers (shown as filled triangles) were chosen after comparison of the sequences with pairwise BLAST. The regions thus designated as highly conserved are highlighted by the shaded rectangles. (Additional details about the BLAST parameters used, the extent of the conserved regions, and the data supporting the transcript processing pattern, are provided in Supplementary Figure S1.) The positions of four of the six uORFs, shown by asterisks, are strictly conserved (Supplementary Figure S1).

References

    1. Aronson, B. D., Johnson, K. A., and Dunlap, J. C. (1994a). Circadian clock locus frequency: protein encoded by a single open reading frame defines period length and temperature compensation. Proc. Natl. Acad. Sci. USA 91, 7683–7687. - PMC - PubMed
    1. Aronson, B. D., Johnson, K. A., Loros, J. J., and Dunlap, J. C. (1994b). Negative feedback defining a circadian clock: autoregulation of the clock gene frequency. Science 263, 1578–1584. - PubMed
    1. Bell-Pedersen, D., Cassone, V. M., Earnest, D. J., Golden, S. S., Hardin, P. E., Thomas, T. L., and Zoran, M. J. (2005). Circadian rhythms from multiple oscillators: lessons from diverse organisms. Nat. Rev. Genet. 6, 544–556. - PMC - PubMed
    1. Bell-Pedersen, D., Shinohara, M. L., Loros, J. J., and Dunlap, J. C. (1996). Circadian clock-controlled genes isolated from Neurospora crassa are late night- to early morning-specific. Proc. Natl. Acad. Sci. USA 93, 13096–13101. - PMC - PubMed
    1. Cheng, P., Yang, Y., Gardner, K. H., and Liu, Y. (2002). PAS domain-mediated WC-1/WC-2 interaction is essential for maintaining the steady-state level of WC-1 and the function of both proteins in circadian clock and light responses of Neurospora. Mol. Cell. Biol. 22, 517–524. - PMC - PubMed

Publication types

LinkOut - more resources