. 2005 Dec;16(12):5710-8.
doi: 10.1091/mbc.e05-08-0706. Epub 2005 Sep 29.

Centromere positioning and dynamics in living Arabidopsis plants

Affiliations

Centromere positioning and dynamics in living Arabidopsis plants

Yuda Fang et al. Mol Biol Cell. 2005 Dec.

Abstract

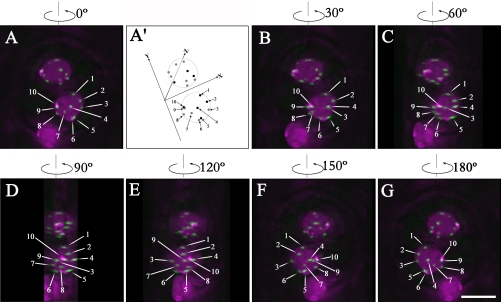
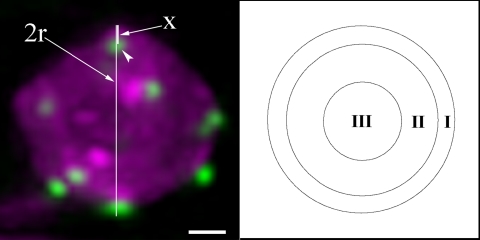
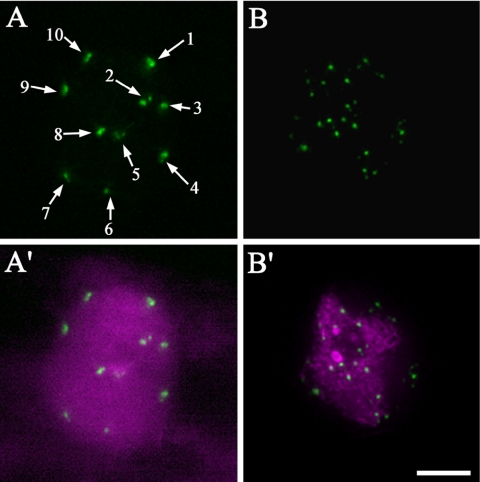
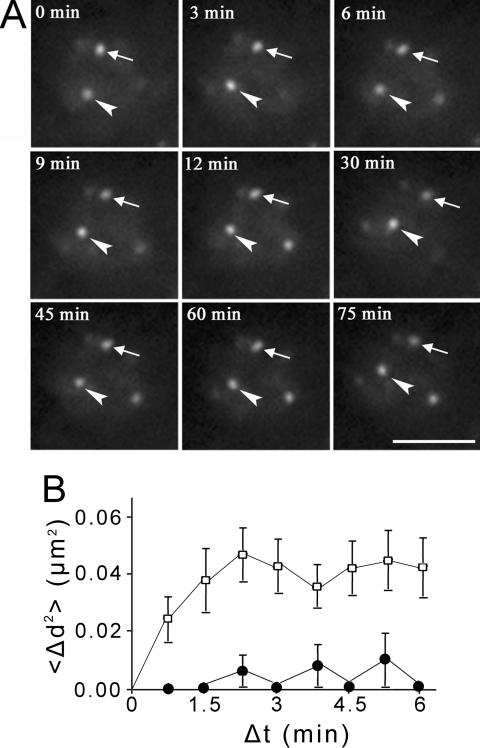
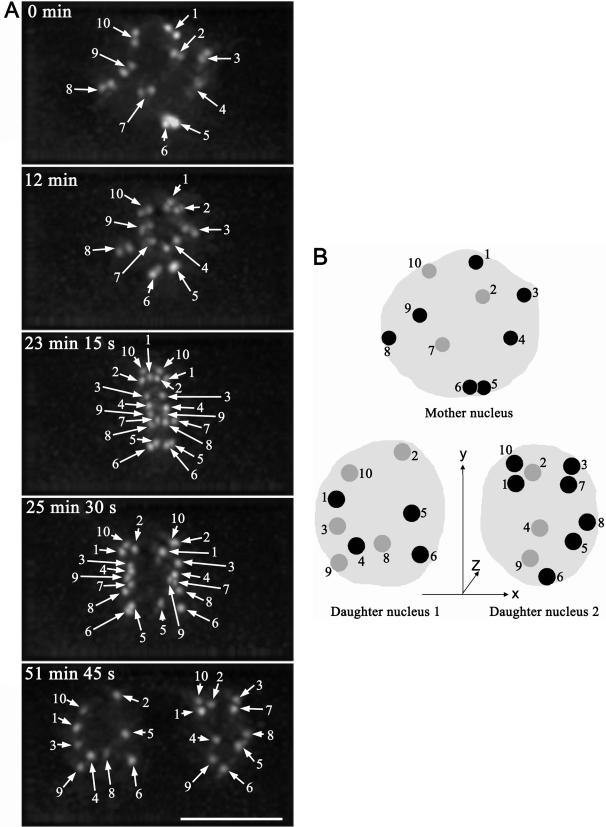
The organization and dynamics of the genome have been shown to influence gene expression in many organisms. Data from mammalian tissue culture cells have provided conflicting conclusions with regard to the extent to which chromatin organization is inherited from mother to daughter nuclei. To gain insight into chromatin organization and dynamics, we developed transgenic Arabidopsis lines in which centromeres were tagged with a green fluorescent protein fusion of the centromere-specific histone H3. Using four-dimensional (4-D) live cell imaging, we show that Arabidopsis centromeres are constrained at the nuclear periphery during interphase and that the organization of endoreduplicated sister centromeres is cell type dependent with predominant clustering in root epidermal cells and dispersion in leaf epidermal cells. 4-D tracking of the entire set of centromeres through mitosis, in growing root meristematic cells, demonstrated that global centromere position is not precisely transmitted from the mother cell to daughter cells. These results provide important insight into our understanding of chromatin organization among different cells of a living organism.


Figures

Figure 1.
Figure 1.
Maximum intensity projections of guard cells from different angles with centromere labeled by HTR12-Venus in green and chromatin labeled by Histone HTB1-CFP in magenta (see also Supplemental Video 1). (A) Projection image of guard cells from 20 image sections with z-interval 0.2 μm. Centromeres in one guard cell were arbitrarily numbered from 1 to 10. (A′) Diagram of positions of centromeres in A. The x-axis represents cell wall between two guard cells, the y-axis is vertical to the x-axis, and the z-axis is directed to the bottom of the guard cell nuclei. Centromeres were defined as brightest spot in the local fluorescent locus. Centromeres from sections 1–10 are represented by dark gray-scaled dots and highlighted by numbered arrows (1, 2, 4, 5, and 10). Centromeres from sections 11–20 are represented by light gray-scaled dots and highlighted by numbered arrows (3, 6, 7, 8, and 9). Also see Supplemental FigureS1. (B) Projection image of guard cells after 30° counterclockwise rotation along vertical axis. Centromeres (3, 6, 7, and 9) at the bottom side of the nuclei move left. Centromere 9 can be observed at the periphery of the projected nuclei. Centromeres (4 and 10) at the topside of the nuclei move right. (C) Projection image of guard cells after 60° counterclockwise rotation along the vertical axis. (D) Projection image of guard cells after 90° counterclockwise rotation along the vertical axis. Centromere 4 and centromere 7, which were at the center of the projected image at 0° (A), can be observed at the nuclear periphery of the projected nucleus. (E) Projection image of guard cells after 120° counterclockwise rotation along the vertical axis. (F) Projection image of guard cells after 150° counterclockwise rotation along the vertical axis. (G) Projection image of guard cells after 180° counterclockwise rotation along vertical axis. Bar, 5 μm.
Figure 2.
Figure 2.
Diagram of the approach used for quantitative analyses of centromere positions. A projection image of a small leaf epidermal cell nucleus is shown in the left panel. Centromeres were labeled by HTR12-Venus in green, and nucleus was labeled by HTB1-CFP in magenta. The distance of the centromere of interest (arrowhead) to the nuclear periphery (x) is divided by the nuclear radius (r). Centromere position can be mapped to three concentric zones of equal surface (I, II, and III) as described in Materials and Methods. Bar, 1 μm.
Figure 3.
Figure 3.
Centromere organization in endoreduplicated cell types. (A) Centromeres in a larger root epidermal cell. (A′) Overlay of centromeres in green and chromatin in magenta. (B) Centromeres in a larger leaf epidermal pavement cell. (B′) Overlay of centromeres in green and chromatin in magenta. Bar, 5 μm.
Figure 4.
Figure 4.
Dynamics of centromeres in interphase. (A) Time-lapse single z-section images of a root meristematic cell in interphase. The two centromeres remaining in the focal plane during the imaging period are highlighted with an arrow and arrowhead. The elapsed time is indicated at the top left corner of each image (also see Supplemental Video 2). Bar, 5 μm. (B) Overall mean squared displacement in distance between two centromeres <Δd2> plotted against elapsed time <Δt>. Unfilled squares (□) represent data from living cells and filled circles (•)represent data from fixed samples. Vertical bars at each time point show the SEs for the particular set of data collected in five independent experiments.
Figure 5.
Figure 5.
Tracking centromeres through mitosis in 3-D (also see Supplemental Video 3). (A) Projection images of nuclei of a mitotic cell at elapse time of 0 min, 12 min, 23 min 15 s, 25 min 30 s, and 51 min 45 s. Centromeres are highlighted with numbered arrows at each time point. Bar, 5 μm. (B) Diagram of positions of centromeres in nuclei of mother cell and two daughter cells. The z-axis is directed to the bottom of the nuclei. Centromeres from the top four sections of the nuclei are represented by numbered dark gray-scaled dots, and centromeres from the bottom three sections of the nuclei are represented by numbered light gray-scaled dots (also see Supplemental Figure S2).

References

    1. Abney, J. R., Cutler, B., Fillbach, M. L., Axelrod, D., and Scalettar, B. A. (1997). Chromatin dynamics in interphase nuclei and its implications for nuclear structure. J. Cell Biol. 137, 1459-1468. - PMC - PubMed
    1. Abranches, R., Beven, A. F., Aragon-Alcaide, L., and Shaw, P. J. (1998). Transcription sites are not correlated with chromosome territories in wheat nuclei. J. Cell Biol. 143, 5-12. - PMC - PubMed
    1. Agard, D. A., and Sedat, J. W. (1983). Three-dimensional architecture of a polytene nucleus. Nature 302, 676-681. - PubMed
    1. Appelgren, H., Kniola, B., and Ekwall, K. (2003). Distinct centromere domain structures with separate functions demonstrated in live fission yeast cells. J. Cell Sci. 116, 4035-4042. - PubMed
    1. Berg, H. C. (1993). Random Walks in Biology, Princeton, NJ: Princeton University Press.

Publication types

LinkOut - more resources