. 2005 Dec;16(12):5719-35.
doi: 10.1091/mbc.e05-06-0572. Epub 2005 Sep 29.

Induction of dedifferentiation, genomewide transcriptional programming, and epigenetic reprogramming by extracts of carcinoma and embryonic stem cells

Affiliations

Induction of dedifferentiation, genomewide transcriptional programming, and epigenetic reprogramming by extracts of carcinoma and embryonic stem cells

Christel K Taranger et al. Mol Biol Cell. 2005 Dec.

Abstract

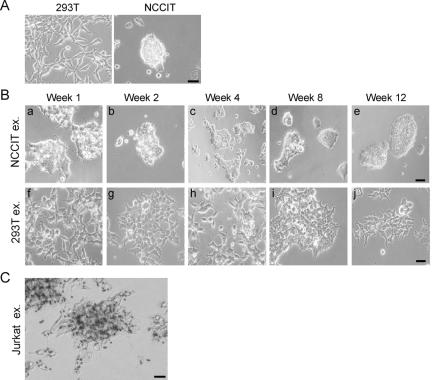
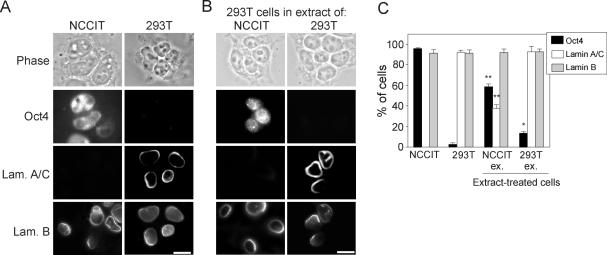
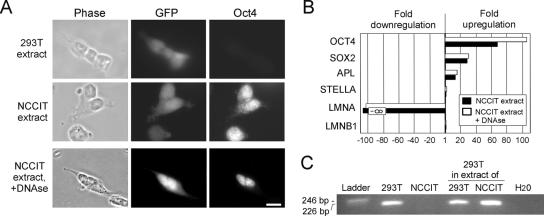
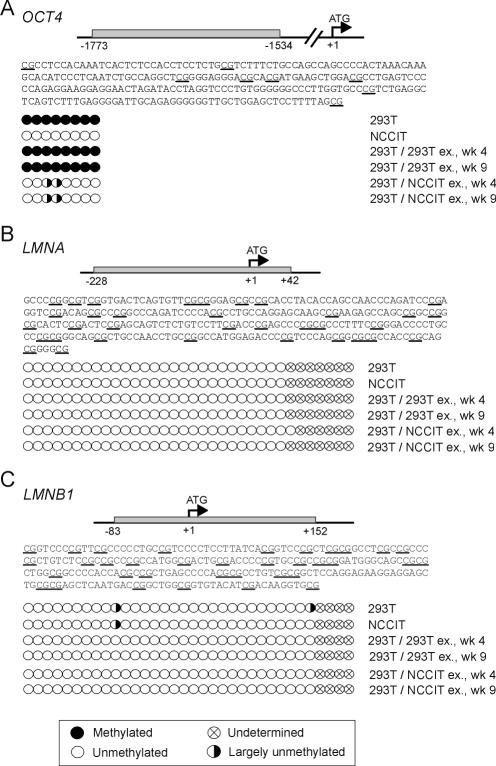
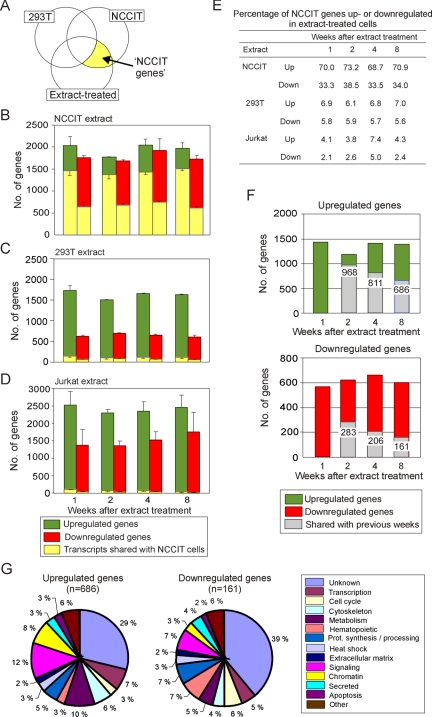
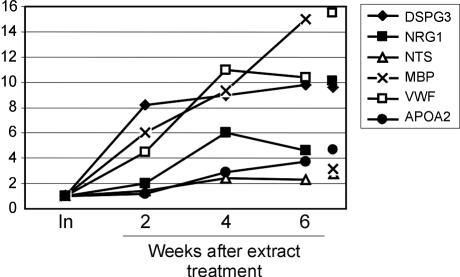
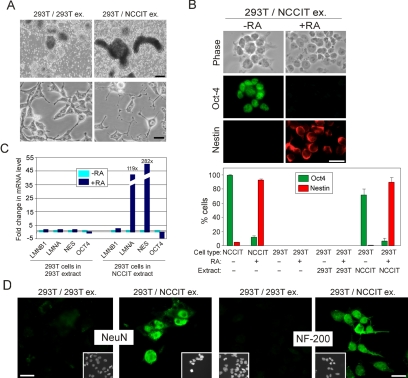
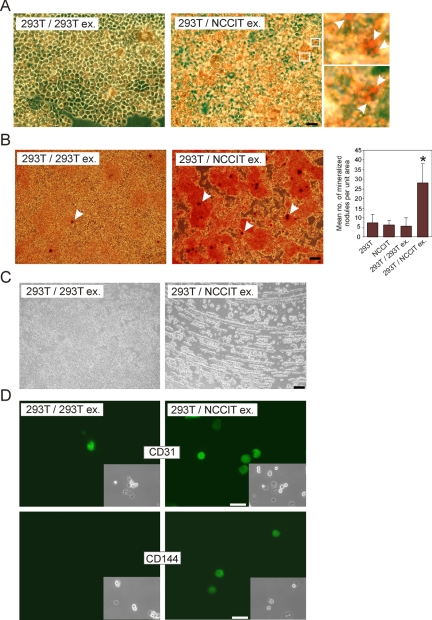
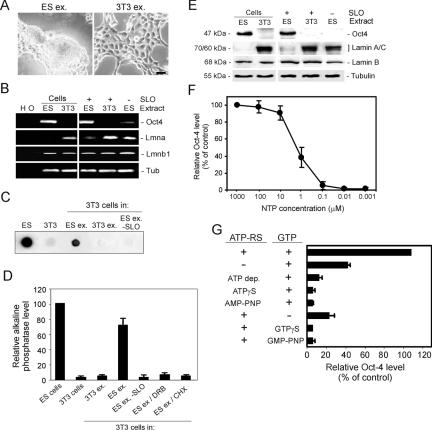
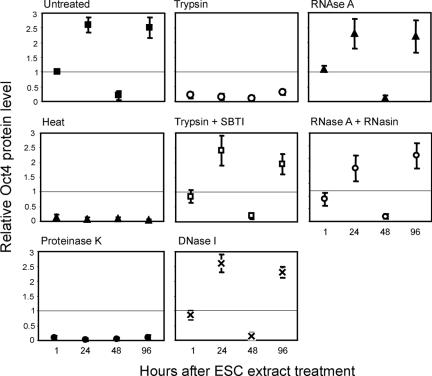
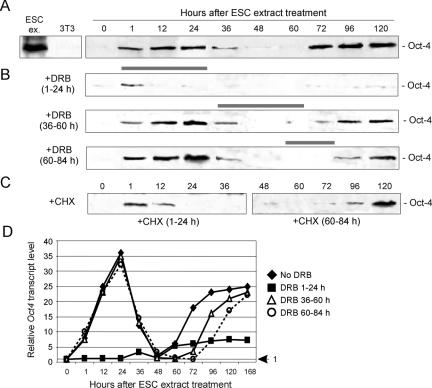
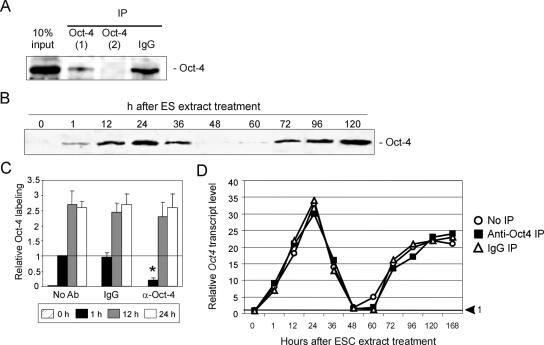
Functional reprogramming of a differentiated cell toward pluripotency may have long-term applications in regenerative medicine. We report the induction of dedifferentiation, associated with genomewide programming of gene expression and epigenetic reprogramming of an embryonic gene, in epithelial 293T cells treated with an extract of undifferentiated human NCCIT carcinoma cells. 293T cells exposed for 1 h to extract of NCCIT cells, but not of 293T or Jurkat T-cells, form defined colonies that are maintained for at least 23 passages in culture. Microarray and quantitative analyses of gene expression reveal that the transition from a 293T to a pluripotent cell phenotype involves a dynamic up-regulation of hundreds of NCCIT genes, concomitant with down-regulation of 293T genes and of indicators of differentiation such as A-type lamins. Up-regulated genes encompass embryonic and stem cell markers, including OCT4, SOX2, NANOG, and Oct4-responsive genes. OCT4 activation is associated with DNA demethylation in the OCT4 promoter and nuclear targeting of Oct4 protein. In fibroblasts exposed to extract of mouse embryonic stem cells, Oct4 activation is biphasic and RNA-PolII dependent, with the first transient rise of Oct4 up-regulation being necessary for the second, long-term activation of Oct4. Genes characteristic of multilineage differentiation potential are also up-regulated in NCCIT extract-treated cells, suggesting the establishment of "multilineage priming." Retinoic acid triggers Oct4 down-regulation, de novo activation of A-type lamins, and nestin. Furthermore, the cells can be induced to differentiate toward neurogenic, adipogenic, osteogenic, and endothelial lineages. The data provide a proof-of-concept that an extract of undifferentiated carcinoma cells can elicit differentiation plasticity in an otherwise more developmentally restricted cell type.


Figures

Figure 1.
Figure 1.
Morphology of 293T cells treated with NCCIT extract. (A) Untreated 293T and NCCIT cells. (B) 293T cells at indicated time points after exposure to NCCIT (a–e) or 293T (f–j) extract. (C) 293T cells 10 d after exposure to Jurkat extract and cultured under T-cell growth conditions. Dark spots are Dynal Biotech (Montebello, Norway) magnetic beads bearing antibodies against CD3 and CD28 surface antigens and used to promote T-cell expansion. Bars, 30 μm.
Figure 2.
Figure 2.
Immunofluorescence analysis of Oct4, lamin A/C and B-type lamin expression in 293T cells exposed to NCCIT extract. Untreated NCCIT and 293T cells (A) and 293T cells (B) treated with NCCIT or 293T extract were immunolabeled with antibodies against Oct4, lamin A/C, and B-type lamins (B, 1 wk after extract treatment). Bars, 20 μm. (C) Proportions (mean ± SD) of untreated NCCIT and 293T cells and of extract-treated cells expressing Oct4, lamin A/C, and B-type lamins. Three sets of 200 cells were examined for each marker. *p < 0.05 compared with 293T cells (t test); **p < 0.001 compared with 293T cells and 293T cells treated with 293T extract (t test).
Figure 3.
Figure 3.
Oct4 expression in EGFP-labeled 293T cells. (A) 293T cells stably expressing EGFP and a geneticin resistance (GenR) gene were treated with 293T or NCCIT extract and cultured for 2 wk with 700 ng/ml geneticin before immunolabeling with anti-Oct4 antibodies. NCCIT extract was also treated with 500 μg/ml DNAse I before incubating cells (bottom row). Bar, 20 μm. (B) Quantitative RT-PCR analysis of expression of indicated genes in 293T-EGFP-GenR cells 2 wk after incubation in intact or DNAse I-treated NCCIT extract (relative to 293T extract-treated controls). (C) PCR analysis of the presence of SV40 large T antigen in 293T, NCCIT, and extract-treated cells. Ladder is a 123-base pair DNA ladder.
Figure 4.
Figure 4.
Bisulfite sequencing analysis of DNA methylation changes in extract-treated cells. 293T cells, NCCIT cells, and cells treated with 293T or NCCIT extract were examined for cytosine methylation in underlined CpG dinucleotides within shown genomic regions of the human OCT4 (A), LMNA (B), and LMNB1 (C) genes. Diagrams show localization (nucleotide numbers) of regions examined relative to the ATG translation start (+1).
Figure 5.
Figure 5.
Microarray analysis of gene expression in extract-treated 293T cells. (A) Venn diagram identifying “NCCIT-specific” genes (yellow area). Numbers of genes up- or down-regulated more than threefold (relative to input 293T cells) in cells incubated in extract of NCCIT (B), 293T (C), and Jurkat (D) cells (mean ± SD of two [B and C] and four [D] experiments). Yellow bars indicate genes up- or down-regulated in extract-treated cells and shared with NCCIT cells. In B, the likelihood that NCCIT genes are up- or down-regulated by chance rather than by extract treatment is extremely low (p < 10-5 and p < 10-4, respectively; t tests). By contrast, in C and D these probabilities are relatively high (p > 0.07 and p > 0.08, respectively; t tests). (E) Percentage of NCCIT genes up- or down-regulated in extract-treated cells (percentage of total up- or down-regulated genes). (F) Number of NCCIT genes specifically up- or down-regulated by treatment with NCCIT extract, over time. (G) Consistency of gene up- or down-regulation over time after treatment with NCCIT extract. Numbers of up- and down-regulated NCCIT genes in cells exposed to NCCIT extract are shown in green and red. Gray bars represent genes consistently up- or down-regulated at weeks 1 and 2 (gray bars at week 2), weeks 1, 2, and 4 (gray bars at week 4), etc., and shared between the two experiments. (H) Functional class distribution of genes consistently up- or down-regulated over 8 wk in two experiments (gray bars in G). These genes are listed in Table S3.
Figure 6.
Figure 6.
Quantitative RT-PCR analysis of expression of indicated multilineage priming genes in 293T cells treated with NCCIT extract relative to transcript levels in 293T cells exposed to 293T extract. Expression levels were adjusted to those of GAPDH in triplicate samples. Single data points show mean expression level in NCCIT cells.
Figure 7.
Figure 7.
Neuronal differentiation of 293T cells treated with 293T or NCCIT extract. (A) Top, induction of differentiation. Suspended aggregates after 2 wk of culture with 10 μM all-trans-retinoic acid. Bottom, differentiation. Cells were plated onto poly-l-lysine-coated coverslips after 2 d of culture in the absence of retinoic acid but with mitotic inhibitors. Note neurite extensions in NCCIT extract-treated cells. (B) NCCIT extract-treated cells either treated with retinoic acid (+RA) or not (-RA) for 3 wk were immunolabeled using antibodies against Oct4 and nestin. Graph shows proportions (mean ± SD) of cells immunolabeled with anti-Oct4 and anti-nestin antibodies (n = 200 cells in each of a triplicate analysis for each treatment). (C) Quantitative RT-PCR analysis of expression of OCT4, NES (nestin), LMNA and LMNB1 in 293T cells treated with 293T or NCCIT extract, in absence (-RA) or presence (+RA) or retinoic acid for 3 wk. (D) NeuN and NF200 immunofluorescence analysis of indicated cell types induced to differentiate as described in A. Insets, DNA labeled with Hoechst 33342. Bars, 400 μm (A, top); 40 μm (A, bottom); 40 μm (B and D).
Figure 8.
Figure 8.
Induction of adipogenic, osteogenic, and endothelial differentiation of 293T cells treated with 293T or NCCIT extract. (A and B) Cells were exposed to 10 μM retinoic acid for 21 d, washed, and cultured in the absence of retinoic acid in adipocyte (A) or osteoblast (B) differentiation medium for 21 d. (A) Cells were stained with Oil-Red-O to reveal lipid droplets. Images on the right are enlargements of two areas framed in white in the adjacent panel (top right-hand quadrant). Arrows point to strongly stained lipid droplets. (B) Cells were stained with Alzarin red to visualize mineralized nodules (arrows). Graph shows mean ± SD number of distinct strongly mineralized nodules (arrows) per unit area (area shown in B). Twenty-four to 27 areas were analyzed within wells of six-well culture plates. *p < 10-6 relative to other treatments (ANOVA). (C) 293T and NCCIT extract-treated cells were passaged onto methylcellulose for 7 d to elicit endothelial differentiation. Note the formation of a track phenotype characteristic of cultured endothelial cells (right). (D) Direct immunofluorescence labeling of CD31 and CD144 surface antigens in extract-treated cells induced to differentiate as described in C. After differentiation, cells were loosened from the methylcellulose semisolid substrate by dilution with PBS and thus lost their elongated phenotype. Bars, 40 μm (A), 200 μm (B and C), and 40 μm (D).
Figure 9.
Figure 9.
Induction of Oct4 and ALP expression in 3T3 cells exposed to mouse ESC extract. (A) 3T3 cells 10 d after treatment with ESC extract (ES ex.) or 3T3 extract (3T3 ex.). Bar, 20 μm. (B) RT-PCR analysis of expression of indicated genes in ESCs, 3T3 cells and 3T3 cells at 2 wk after treatment with ESC extract. (C) ALP expression in cells treated as described in B (2 wk after extract treatment). (D) Relative ALP level in ESCs, 3T3 cells, and in 3T3 cells treated in 3T3 extract or in ESC extract alone or with 25 μM DRB or 10 μg/ml CHX, as indicated. Cells were analyzed 2 wk after extract treatment. (E) Indicated cell types (as in B) were analyzed by Western blotting for expression of Oct4, lamin A/C, B-type lamins, and γ-tubulin, 2 wk after extract treatment. (F) Relative Oct4 level in 3T3 cells treated with ESC extract containing decreasing concentrations of NTPs (1 wk after extract treatment). (G) Relative Oct4 level in 3T3 cells exposed to ESC extract containing indicated ATP or GTP analogues. ATP-RS, ATP-regenerating system (2 wk after extract treatment).
Figure 10.
Figure 10.
Relative Oct4 protein levels in 3T3 cells exposed to ESC extract pretreated as indicated in each panel. Cells were cultured for 1–96 h after extract treatment, lysed, and analyzed by Western blotting. Oct4 protein levels were determined by densitometric analysis of duplicate blots for each time point under each condition. Level 1 indicates Oct4 level at 1 h after removal of cells from an untreated ESC extract (top left).
Figure 11.
Figure 11.
Oct4 expression in ESC extract-treated cells is biphasic and RNA PolII dependent. (A) Immunoblotting analysis of intracellular Oct4 levels in 3T3 cells treated with ESC extract and cultured for indicated time periods. (B) Cells were exposed to 25 μM DRB at 1–24 h (top), 36–60 h (middle), and 60–84 h (bottom) of culture. (C) Cells were exposed to 10 μg/ml CHX at 1–24 h (left) or 60–84 h (right) of culture before immunoblotting. (D) Real-time RT-PCR analysis of Oct4 expression in 3T3 cells exposed to ESC extract. Cells were cultured with 0 or 25 μM DRB at indicated time periods as described in B. Reference level (level 1) is Oct4 mRNA level in 3T3 cells immediately upon plating cells after recovery from extract. Data show a representative set from two experiments.
Figure 12.
Figure 12.
Immunodepletion of Oct4 from ESC extract maintains Oct4 expression profile. (A) Immunoprecipitation of Oct4 from ESC extract. Numbers indicate rounds of immunoprecipitation (IP). Resulting extracts were immunoblotted using anti-Oct4 antibodies. (B) 3T3 cells were exposed to immunodepleted ESC extract, cultured for indicated time periods, and blotted using anti-Oct4 antibodies. (C) Relative intracellular Oct4 protein level in 3T3 cells exposed to control (no antibody), mock-depleted (IgG), or anti-Oct4-depleted ESC extract and cultured for indicated time periods. *p < 0.001 relative to the 1-h time point in other treatments (ANOVA). Data from two experiments. (D) Real-time RT-PCR analysis of Oct4 expression in 3T3 cells exposed to intact, mock-depleted, or Oct4-depleted ESC extract. Reference level (level 1) is Oct4 transcript level in 3T3 cells immediately upon plating cells after recovery from extract. Data show a representative set of two experiments.

References

    1. Akashi, K., He, X., Chen, J., Iwasaki, H., Niu, C., Steenhard, B., Zhang, J., Haug, J., and Li, L. (2003). Transcriptional accessibility for genes of multiple tissues and hematopoietic lineages is hierarchically controlled during early hematopoiesis. Blood 101, 383-389. - PubMed
    1. Avilion, A. A., Nicolis, S. K., Pevny, L. H., Perez, L., Vivian, N., and Lovell-Badge, R. (2003). Multipotent cell lineages in early mouse development depend on SOX2 function. Genes Dev. 17, 126-140. - PMC - PubMed
    1. Blelloch, R. H., Hochedlinger, K., Yamada, Y., Brennan, C., Kim, M., Mintz, B., Chin, L., and Jaenisch, R. (2004). Nuclear cloning of embryonal carcinoma cells. Proc. Natl. Acad. Sci. USA 101, 13985-13990. - PMC - PubMed
    1. Boquest, A. C., Shahdadfar, A., Fronsdal, K., Sigurjonsson, O., Tunheim, S. H., Collas, P., and Brinchmann, J. E. (2005). Isolation and transcription profiling of purified uncultured human stromal stem cells: alteration of gene expression following in vitro cell culture. Mol. Biol. Cell 16, 1131-1141. - PMC - PubMed
    1. Byrne, J. A., Simonsson, S., Western, P. S., and Gurdon, J. B. (2003). Nuclei of adult mammalian somatic cells are directly reprogrammed to oct-4 stem cell gene expression by amphibian oocytes. Curr. Biol. 13, 1206-1213. - PubMed

Publication types

Substances