Comparative Study
. 2005 Dec;89(6):3884-94.
doi: 10.1529/biophysj.105.060640. Epub 2005 Sep 30.

A multiscale model for avascular tumor growth

Affiliations
Comparative Study

A multiscale model for avascular tumor growth

Yi Jiang et al. Biophys J. 2005 Dec.

Erratum in

  • Biophys J. 2006 Jul 15;91(2):775

Abstract

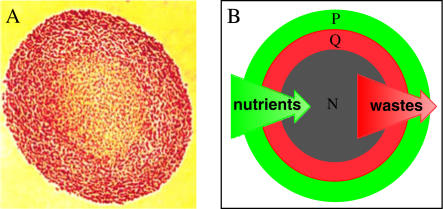
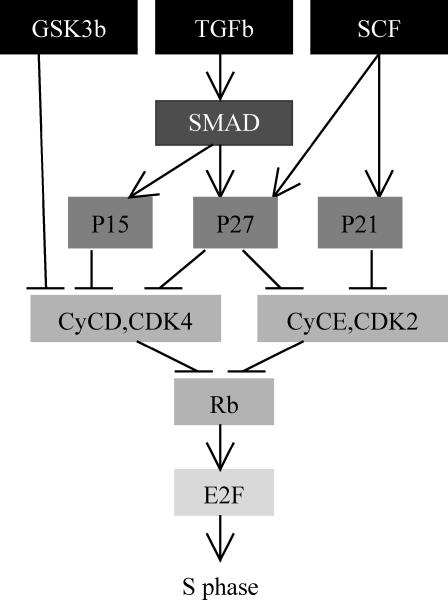
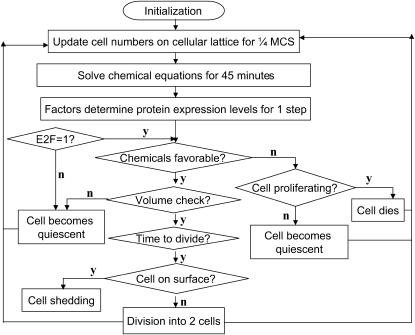
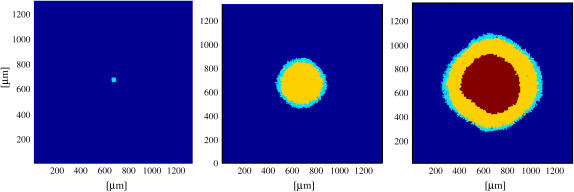
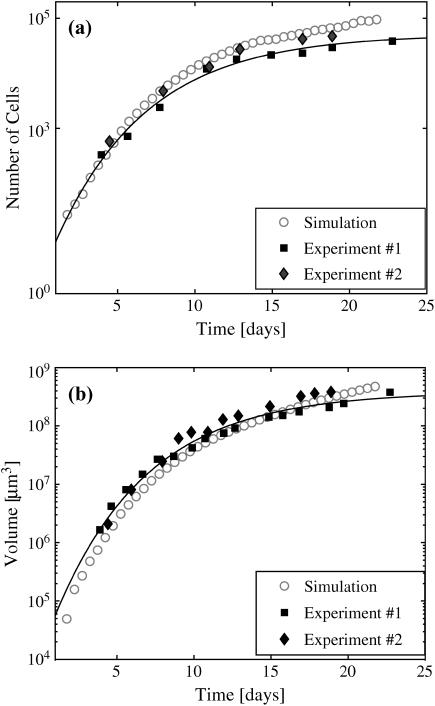
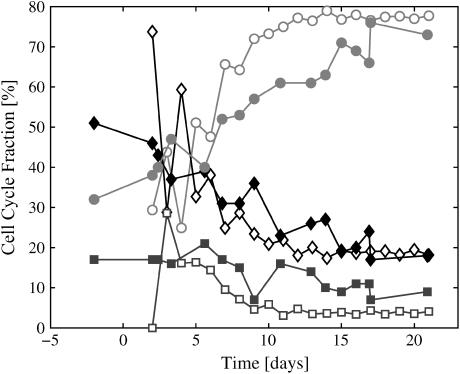
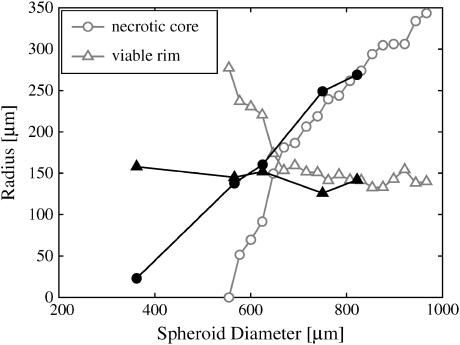
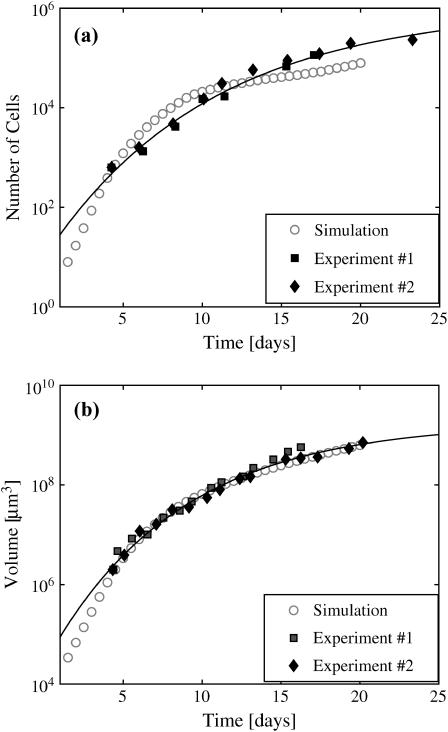
The desire to understand tumor complexity has given rise to mathematical models to describe the tumor microenvironment. We present a new mathematical model for avascular tumor growth and development that spans three distinct scales. At the cellular level, a lattice Monte Carlo model describes cellular dynamics (proliferation, adhesion, and viability). At the subcellular level, a Boolean network regulates the expression of proteins that control the cell cycle. At the extracellular level, reaction-diffusion equations describe the chemical dynamics (nutrient, waste, growth promoter, and inhibitor concentrations). Data from experiments with multicellular spheroids were used to determine the parameters of the simulations. Starting with a single tumor cell, this model produces an avascular tumor that quantitatively mimics experimental measurements in multicellular spheroids. Based on the simulations, we predict: 1), the microenvironmental conditions required for tumor cell survival; and 2), growth promoters and inhibitors have diffusion coefficients in the range between 10(-6) and 10(-7) cm2/h, corresponding to molecules of size 80-90 kDa. Using the same parameters, the model also accurately predicts spheroid growth curves under different external nutrient supply conditions.


Figures

FIGURE 1
FIGURE 1
Illustration of the morphology and proliferative status of cells in multicellular spheroids of the EMT6/Ro cell line. (A) Histological cross-section (optical microscopic image) through the center of a spheroid ∼1200 μm in diameter stained with eosin and hematoxalin, showing the viable rim of cells (red) and the necrotic center (orange). (B) Diagram illustrating the relative distributions of proliferating (green, P) and quiescent (red, Q) cells and central necrosis (gray, N) in a spheroid, relative to the gradients in nutrients and waste products. There is not actually a sharp demarcation between proliferating and quiescent cells as is the case for viable/necrotic boundary; rather, the fraction of proliferating cells decreases continuously across the viable cell rim.
FIGURE 2
FIGURE 2
Simplified protein regulatory network for the G1-S phase transition. The G1 phase consists of six stages (six levels of grayscale).
FIGURE 3
FIGURE 3
Flow chart of the model showing the integration between the intra-, inter-, and extracellular levels.
FIGURE 4
FIGURE 4
From simulation, cross-sectional view of a spheroid at different stages of development, with cyan, yellow, and magenta correspond to proliferating, quiescent, and necrotic cells. From left to right, 2 days, 10 days, and 18 days of tumor development, respectively, from a single cell.
FIGURE 5
FIGURE 5
The growth curves of spheroid with 0.08 mM O2 and 5.5 mM glucose in the medium. (a) The number of cells and (b) the volume of spheroid in time. The solid diamonds and squares are experimental data for EMT6/Ro, the circles are simulation results. The solid lines are the best fit with a Gompertz function (see text) for experimental data.
FIGURE 6
FIGURE 6
Cell-cycle fraction as a function of time with 0.08 mM O2 and 5.5 mM glucose in the medium. Solid symbols are experimental measurements from the EMT6/Ro cell line; open symbols are the corresponding simulation. (Red lines indicate G1-phase, black lines indicate S-phase, and blue lines indicate the G2-phase.)
FIGURE 7
FIGURE 7
Size of viable rim versus spheroid diameter with 0.08 mM O2 and 5.5 mM glucose in the medium. After initial linear growth, viable rim thickness reaches approximately constant value. Solid symbols are experimental data from the EMT6/Ro cell line; open symbols are simulation results.
FIGURE 8
FIGURE 8
The growth curves of spheroid with 0.28 mM O2 and 16.5 mM glucose in the medium: (a) the number of cells and (b) the volume of spheroid in time. The solid diamonds and squares are experimental data for EMT6/Ro; open circles are simulation results. The solid lines are the best fit with a Gompertz function to the experimental data.

References

    1. Osada, H., and T. Takahashi. 2002. Genetic alterations of multiple tumor suppressors and oncogenes in the carcinogenesis and progression of lung cancer. Oncogene. 21:7421–7434. - PubMed
    1. Klaunig, J. E., and L. M. Kamendulis. 2004. The role of oxidative stress in carcinogenesis. Annu. Rev. Pharmacol. Toxicol. 44:239–267. - PubMed
    1. Mueller-Klieser, W. 2000. Tumor biology and experimental therapeutics. Crit. Rev. Oncol. Hematol. 36:123–139. - PubMed
    1. Brown, J. M. 2002. Tumor microenvironment and the response to anticancer therapy. Cancer Biol. Ther. 1:453–458. - PubMed
    1. Vaupel, P., and M. Hockel. 2000. Blood supply, oxygenation status and metabolic micromilieu of breast cancers: characterization and therapeutic relevance (Review). Int. J. Oncol. 17:869–879. - PubMed

Publication types

LinkOut - more resources