. 2005 Dec;89(6):4029-42.
doi: 10.1529/biophysj.105.067959. Epub 2005 Sep 30.

Fluorescence correlation spectroscopy diffusion laws to probe the submicron cell membrane organization

Affiliations

Fluorescence correlation spectroscopy diffusion laws to probe the submicron cell membrane organization

Laure Wawrezinieck et al. Biophys J. 2005 Dec.

Abstract

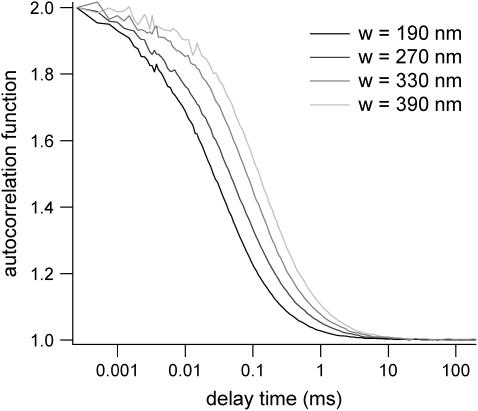
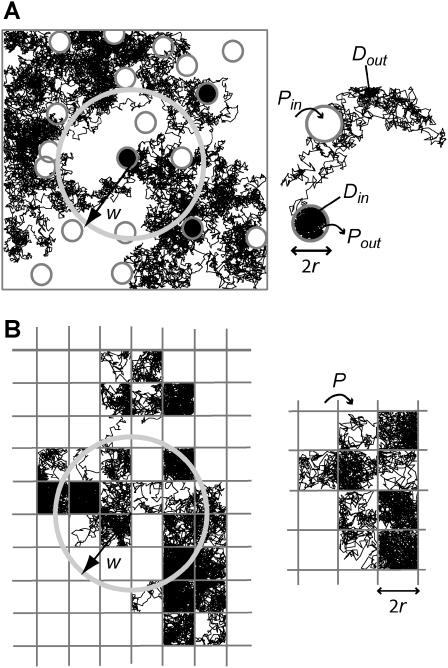
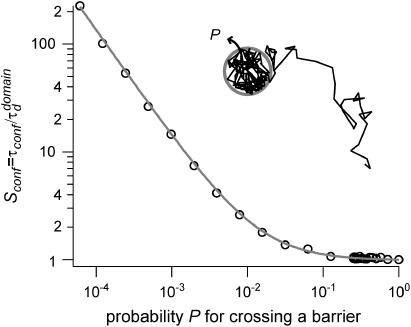
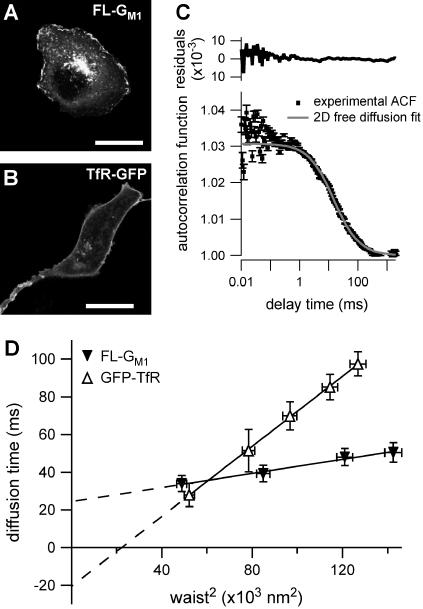
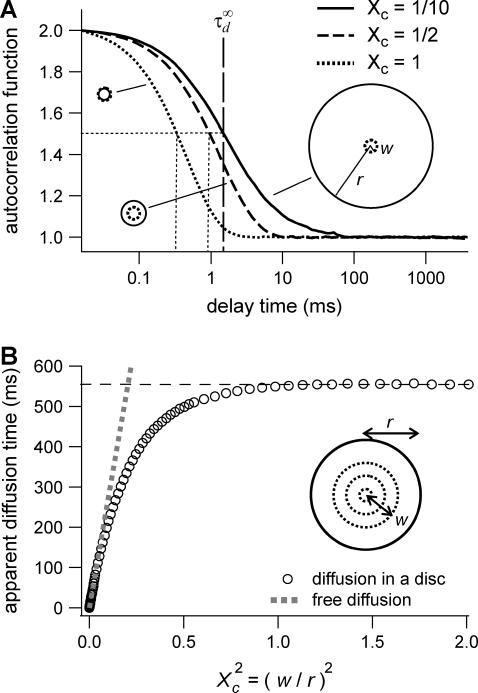
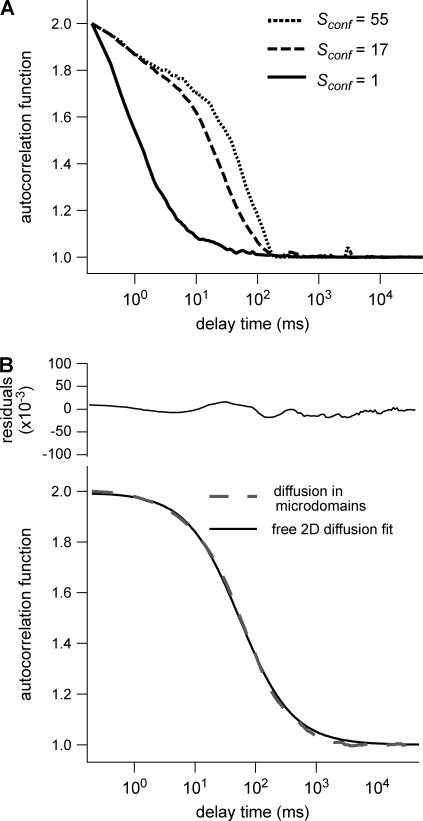
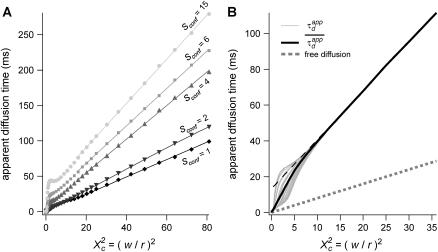
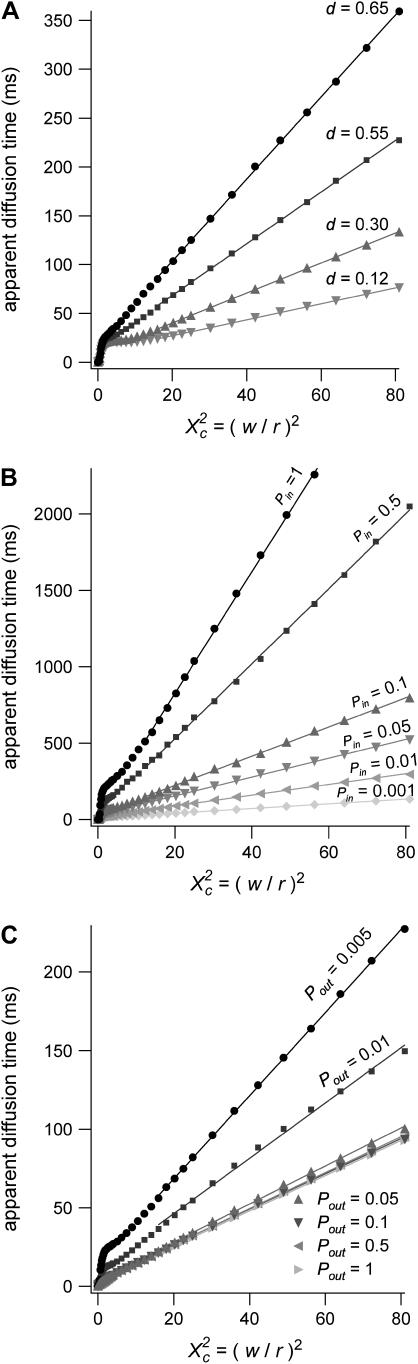
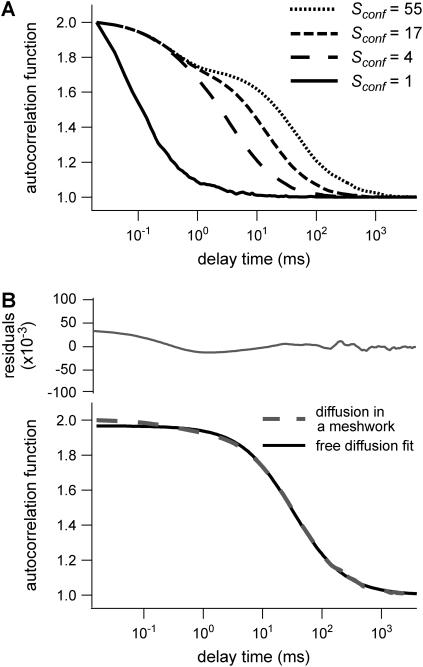
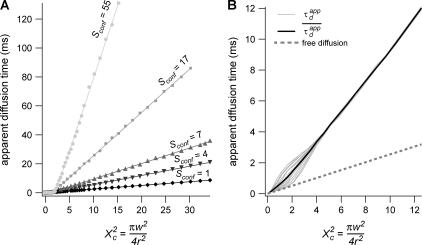
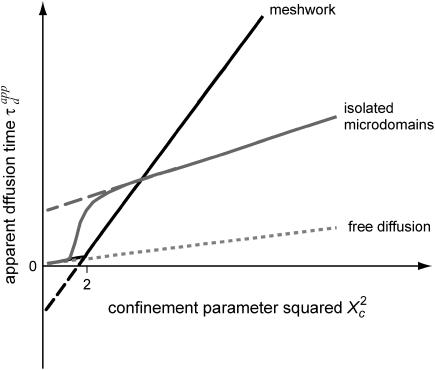
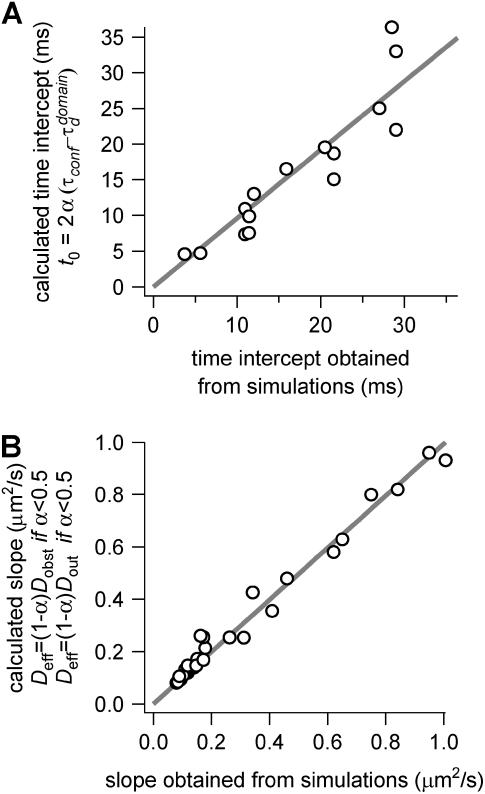
To probe the complexity of the cell membrane organization and dynamics, it is important to obtain simple physical observables from experiments on live cells. Here we show that fluorescence correlation spectroscopy (FCS) measurements at different spatial scales enable distinguishing between different submicron confinement models. By plotting the diffusion time versus the transverse area of the confocal volume, we introduce the so-called FCS diffusion law, which is the key concept throughout this article. First, we report experimental FCS diffusion laws for two membrane constituents, which are respectively a putative raft marker and a cytoskeleton-hindered transmembrane protein. We find that these two constituents exhibit very distinct behaviors. To understand these results, we propose different models, which account for the diffusion of molecules either in a membrane comprising isolated microdomains or in a meshwork. By simulating FCS experiments for these two types of organization, we obtain FCS diffusion laws in agreement with our experimental observations. We also demonstrate that simple observables derived from these FCS diffusion laws are strongly related to confinement parameters such as the partition of molecules in microdomains and the average confinement time of molecules in a microdomain or a single mesh of a meshwork.


Figures

FIGURE 1
FIGURE 1
Rh6G autocorrelation functions measured by FCS at various beam waists w. The diffusion time is used to calibrate w.
FIGURE 2
FIGURE 2
Simulated trajectories of a molecule in the cell membrane drawn for two models of confined diffusion. Fluorescence fluctuations arise from the detection volume of size w that is defined by a laser beam. In real optics, the diffraction limit sets in the minimum size w to wmin ∼ 190 nm. (A) Model for isolated microdomains: static circular microdomains of radius r are embedded in a fluid phase. The molecules have a Brownian motion as long as they stay in the same phase. The probabilities of going into and out of the microdomains, Pin and Pout respectively, can be asymmetric. Here, r = 100 nm, w = 600 nm, Pin = 0.05, and Pout = 0.02. (B) Meshwork model: molecules have to jump over regularly spaced barriers. The molecules have a Brownian motion described by a microscopic diffusion coefficient Dmicro as long as they stay within the same mesh. The probability that the molecule can cross the barrier is P. Here r = 100 nm, w = 500 nm, and P = 0.05.
FIGURE 3
FIGURE 3
Confinement strength of a circular domain as a function of the probability P of crossing the barrier.
FIGURE 4
FIGURE 4
Experimental results on COS-7 cells for FL-GM1 and TfR-GFP. (A) Confocal image of a cell stained with FL-GM1 (scale bar, 20 μm). (B) Confocal image of a TfR-GFP stained cell (scale bar, 20 μm). (C) ACF measured by FCS on FL-GM1 stained cells. (D) Experimental FCS diffusion laws obtained for FL-GM1 and TfR-GFP. Curves are extrapolated to zero beam waist to make the time intercepts more visible, even if the diffusion law at small waists can be different.
FIGURE 5
FIGURE 5
Simulation results for a molecule diffusing in a single impermeable domain. (A) ACFs obtained by FCS. Effect of the domain size on the shape of ACFs drawn for three values of the confinement parameter formula image (B) Apparent diffusion time measured from ACFs as a function of the confinement parameter squared, plotted for a fixed size of the impermeable domain.
FIGURE 6
FIGURE 6
Simulated intensity ACFs for a single molecule diffusing in microdomains delimited by permeable barriers. (A) ACFs are calculated for a confinement parameter formula image and for different probabilities P of crossing the barriers. (B) ACF calculated for a confinement parameter formula image It is well fitted by a free 2D diffusion fit.
FIGURE 7
FIGURE 7
Simulated diffusion laws obtained by FCS: the apparent diffusion time measured from ACFs is plotted as a function of the confinement parameter squared formula image In each case, the chosen probabilities formula image and formula image are equal. (A) Diffusion laws obtained for five confinement strengths formula image Here the laser spot is centered on a microdomain. (B) The diffusion law is averaged on all possible positions of the excitation beam for formula image It is compared to diffusion laws plotted for different positions of the laser spot.
FIGURE 8
FIGURE 8
Simulated diffusion laws obtained by FCS for the microdomain geometry, when d, Pin, or Pout are changed. (A) Diffusion laws as a function of the density of microdomains (i.e., as a function of the ratio of the surface of all microdomains over the whole surface A) for formula image (B) Diffusion laws obtained for different probabilities of going Pin into microdomains (for formula image). (C) Diffusion laws obtained for different probabilities Pout of going out of microdomains (for formula image).
FIGURE 9
FIGURE 9
Simulated results obtained by FCS for permeable meshwork geometry. (A) ACFs are calculated for a confinement parameter formula image and for different probabilities P of crossing the barriers. Effect of the confinement strength on the shape of ACFs. (B) ACF calculated for a confinement parameter formula image It is well fitted by a 2D free diffusion fit.
FIGURE 10
FIGURE 10
(A) Diffusion laws obtained for five confinement strengths formula image and a single position of the excitation beam (the laser spot is centered on a knot of the meshwork). (B) The diffusion law is averaged on all possible positions of the excitation beam (for formula image). It is compared to diffusion laws plotted for different positions of the laser spot.
FIGURE 11
FIGURE 11
Apparent diffusion time with respect to formula image for different geometries of diffusion.
FIGURE 12
FIGURE 12
Parameters of the line describing regime iii of molecules in isolated domains geometry. (A) Time intercept formula image as calculated by Eq. 6 versus the time intercept obtained from the simulations. (B) Slope formula image calculated by Eq. 7 as a function of the slope obtained from the simulations.

Comment in

  • Fluorescence corralation spectroscopy.
    Saxton MJ. Saxton MJ. Biophys J. 2005 Dec;89(6):3678-9. doi: 10.1529/biophysj.105.074161. Epub 2005 Sep 30. Biophys J. 2005. PMID: 16199507 Free PMC article. No abstract available.

References

    1. Jacobson, K., E. D. Sheets, and R. Simson. 1995. Revisiting the fluid mosaic model of membranes. Science. 268:1441–1442. - PubMed
    1. Kusumi, A., Y. Sako, and M. Yamamoto. 1993. Confined lateral diffusion of membrane receptors as studied by single particle tracking (nanovid microscopy). Effects of calcium-induced differentiation in cultured epithelial cells. Biophys. J. 65:2021–2040. - PMC - PubMed
    1. Fujiwara, T., K. Ritchie, H. Murakoshi, K. Jacobson, and A. Kusumi. 2002. Phospholipids undergo hop diffusion in compartmentalized cell membrane. J. Cell Biol. 157:1071–1081. - PMC - PubMed
    1. Singer, S. J., and G. L. Nicolson. 1972. The fluid mosaic model of the structure of cell membranes. Science. 175:720–731. - PubMed
    1. Brown, D. A., and J. K. Rose. 1992. Sorting of GPI-anchored proteins to glycolipid-enriched membrane subdomains during transport to the apical cell surface. Cell. 68:533–544. - PubMed

Publication types

LinkOut - more resources