. 2005 Dec;89(6):4219-33.
doi: 10.1529/biophysj.105.065342. Epub 2005 Sep 30.

Interactions between charged polypeptides and nonionic surfactants

Affiliations

Interactions between charged polypeptides and nonionic surfactants

Helen Sjögren et al. Biophys J. 2005 Dec.

Abstract

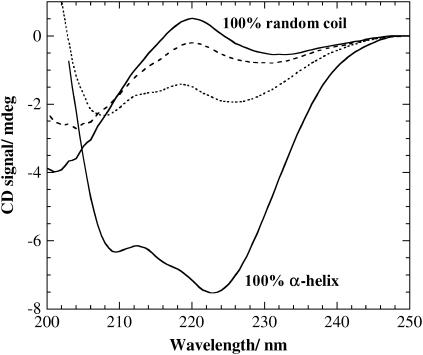
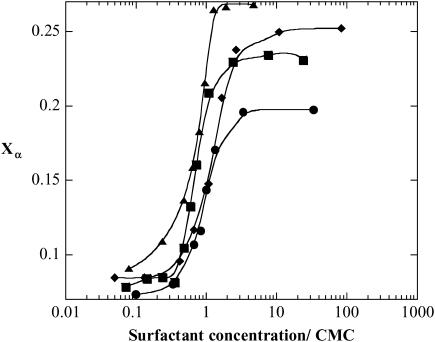
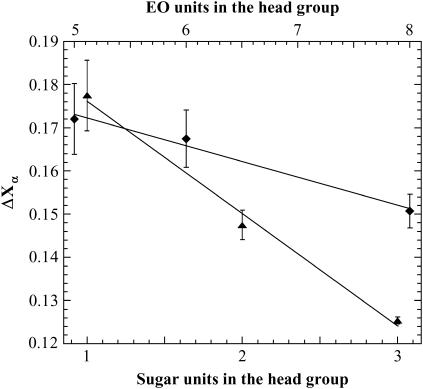
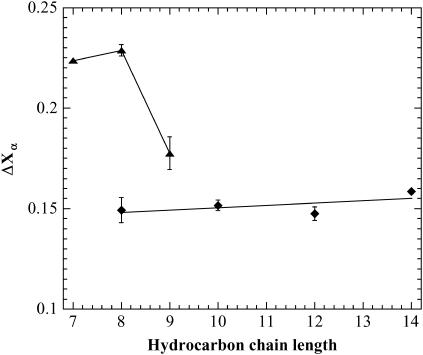
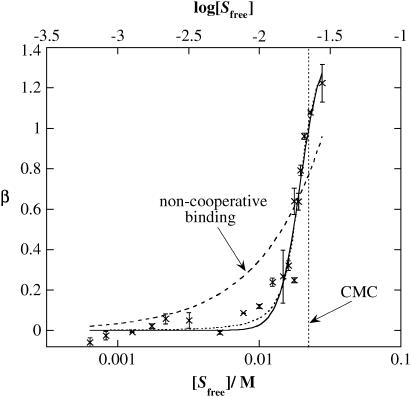
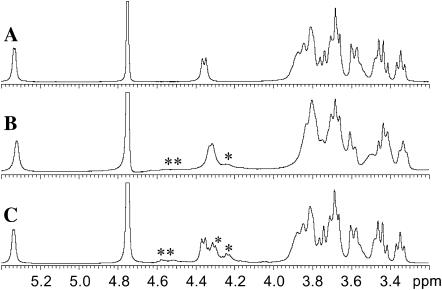
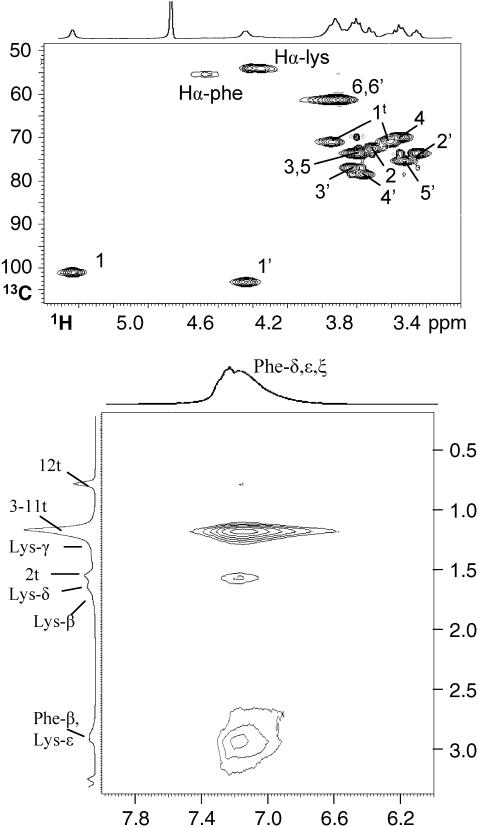
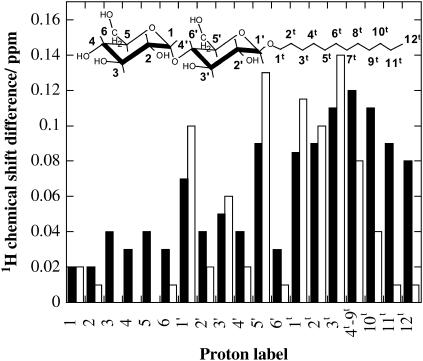
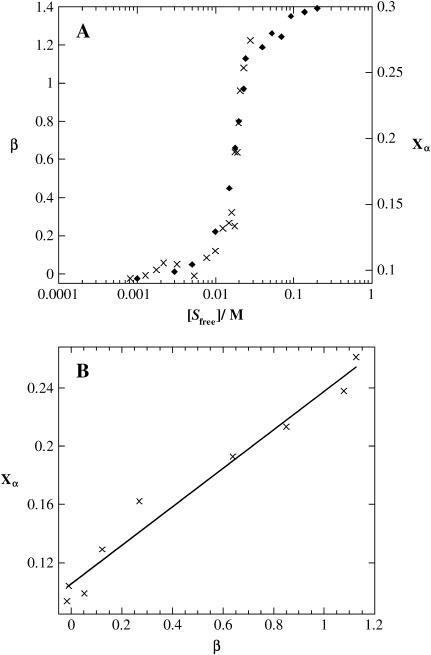
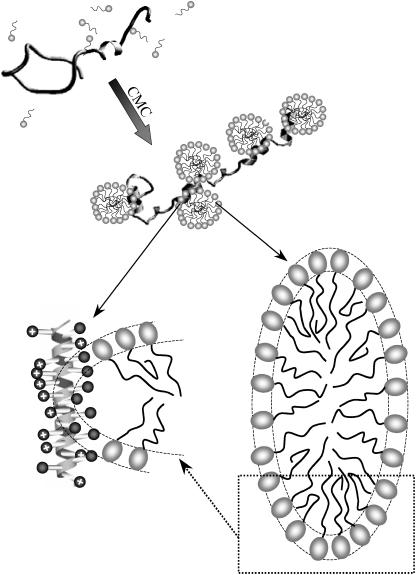
The influence of molecular characteristics on the mutual interaction between peptides and nonionic surfactants has been investigated by studying the effects of surfactants on amphiphilic, random copolymers of alpha-L-amino acids containing lysine residues as the hydrophilic parts. The hydrophobic residues were either phenylalanine or tyrosine. The peptide-surfactant interactions were studied by means of circular dichroism spectroscopy and binding isotherms, as well as by 1D and 2D NMR. The binding of surfactant to the peptides was found to be a cooperative process, appearing at surfactant concentrations just below the critical micellar concentration. However, a certain degree of peptide hydrophobicity is necessary to obtain an interaction with nonionic surfactant. When this prerequisite is fulfilled, the peptide mainly interacts with self-assembled, micelle-like surfactant aggregates formed onto the peptide chain. Therefore, the peptide-surfactant complex is best described in terms of a necklace model, with the peptide interacting primarily with the palisade region of the micelles via its hydrophobic side chains. The interaction yields an increased amount of alpha-helix conformation in the peptide. Surfactants that combine small headgroups with a propensity to form small, nearly spherical micelles were shown to give the largest increase in alpha-helix content.


Figures

FIGURE 1
FIGURE 1
Chemical structure of three different alkylglycosides: n-octyl-β-D-glucoside (β-C8G1), n-dodecyl-α-D-maltoside (α-C12G2), and n-dodecyl-β-D-maltotrioside (β-C12G3). Note the difference between alkylglycosides (surfactants with an undefined number of sugar units in the headgroup) and alkylglucosides (surfactants with one sugar unit in the headgroup).
FIGURE 2
FIGURE 2
CD spectra for (KF)n with (dotted trace) and without (dashed trace) addition of 0.2 M β-C8G1. The reference spectra for 100% α-helix and 100% random coil (solid traces) are given for comparison. A (KF)n concentration of 25 μg/ml (which equals 0.14 mM of amino acid residues) was used in the CD measurements. All measurements were performed in a 20-mM acetate buffer at pH 4.9.
FIGURE 3
FIGURE 3
Surface tension (▴) and the fraction of (KF)n in α-helix conformation (Xα, ♦) as a function of β-C12G2 concentration. A (KF)n concentration of 25 μg/ml (which equals 0.14 mM of amino acid residues) was used in the CD measurements. All measurements were performed in a 20-mM acetate buffer at pH 4.9. The kink in the tensiometric data indicates the CMC of β-C12G2. The solid traces are added as guides for the eye.
FIGURE 4
FIGURE 4
The fraction of (KF)n in α-helix conformation, Xα, as a function of surfactant concentration for α-C12G2 (•), β-C12G2 (▪), β-C9G1 (▴), and C12E5 (♦). All curves are normalized to the CMC of the specific surfactant. A (KF)n concentration of 25 μg/ml (which equals 0.14 mM of amino acid residues) was used, and the measurements were performed in a 20-mM acetate buffer at pH 4.9. The solid traces are added as guides for the eye.
FIGURE 5
FIGURE 5
Increase in peptide α-helix conformation, ΔXα, (determined with CD spectroscopy) as a function of surfactant headgroup size, for β-C12GX surfactants (▴) and C12EX surfactants (♦). A (KF)n concentration of 25 μg/ml (which equals 0.14 mM of amino acid residues) was used, and the measurements were performed in a 20-mM acetate buffer at pH 4.9. Since the Krafft point of β-C12G1 is above room temperature, it cannot be used for comparison. The glucosides are therefore represented by β-C9G1. The data points represent the mean value from at least three independent measurements, and the error bars correspond to 1 SD.
FIGURE 6
FIGURE 6
Increase in peptide α-helix conformation, ΔXα, as determined with CD spectroscopy, as a function of surfactant hydrocarbon chain length, for β-CXG1 surfactants (▴) and β-CXG2 surfactants (♦). Data represent systems with a surfactant concentration of ≥10 × CMC and a (KF)n concentration of 25 μg/ml (which equals 0.14 mM of amino acid residues) in a 20-mM acetate buffer at pH 4.9. The solid traces are added as guides for the eye. The data points represent the mean value from at least three independent measurements, and the error bars correspond to 1 SD.
FIGURE 7
FIGURE 7
Increase in peptide α-helix conformation, ΔXα, (♦) (measured with CD spectroscopy) and the effective hydrodynamic diameter, dH, (▴) (measured with DLS) as a function of (A) temperature for C12E6 and (B) hydrocarbon chain length for β-CXG1. A surfactant concentration of ≥10 × CMC and a (KF)n concentration of 25 μg/ml (which equals 0.14 mM of amino acid residues) were used. The measurements were performed in a 20-mM acetate buffer at pH 4.9. The DLS measurements were performed on solutions of pure surfactant (no peptide added). The solid traces are added as guides for the eye.
FIGURE 8
FIGURE 8
Number of bound β-C8G1 molecules per amino acid residue in (KF)n (β) as a function of free β-C8G1 concentration [Sfree]. [Sfree] as determined by equilibrium dialysis and subsequent NMR assay of surfactant concentration. The data points represent the average of values calculated from signals in three different regions in the NMR spectra, and the error bars correspond to 1 SD. The solid trace is a fit to the Hill equation (Eq. 5), whereas the dashed trace is a fit to the Scatchard equation (noncooperative binding, Eq. 5 with n = 1) and the dotted line to the Satake-Yang equation (Eq. 4).
FIGURE 9
FIGURE 9
Expansion of the aromatic region of 1D 1H NMR spectra acquired at 500 MHz for (A) 80 mM (KF)n, (B) 80 mM (KF)n + 40 mM β-C12G2, (C) 80 mM (K4Y)n, and (D) 80 mM (K4Y)n + 40 mM β-C12G2. All concentrations are given as amino acid residue concentrations. All solutions were prepared in 20 mM deuterated acetate buffer, pD 5.
FIGURE 10
FIGURE 10
Expansion of 1D 1H NMR spectra recorded at 500 MHz showing the sugar proton resonances for (A) 40 mM β-C12G2, (B) 40 mM β-C12G2 + 80 mM (KF)n, and (C) 40 mM β-C12G2 + 80 mM (K4Y)n. Hα peaks of lysine and phenylalanine are indicated by * and **, respectively, in B. Similarly, in C, * and ** indicate the Hα peaks of lysine and tyrosine. For the peptides, all concentrations are given as the amino acid residue concentrations. All solutions were prepared in 20 mM deuterated acetate buffer, pD 5.
FIGURE 11
FIGURE 11
Expansions of the 2D 1H-13C HSQC spectrum (top) and the 2D 1H NOESY spectrum, using a mixing time of 15 ms (bottom), of a mixture of 80 mM (KF)n and 40 mM β-C12G2 solution in 20 mM deuterated acetate buffer, pD 5. For peptides, all concentrations are given as the amino acid residue concentrations. The atom-specific assignment is indicated with the numbering presented in Fig. 12. The NOESY spectrum shows NOE crosspeaks between the aromatic ring protons of the phenylalanine residues and the protons in the aliphatic hydrocarbon chain of β-C12G2. Atom-specific assignments of the 1H peaks are presented in the corresponding regions of the 1D 1H spectrum displayed along the edges of the 2D spectrum.
FIGURE 12
FIGURE 12
1H chemical shift difference for 40 mM β-C12G2 in acetate buffer observed upon addition of 80 mM (KF)n. (solid bars) and 9.3 mM naphthylacetate (open bars). For peptides, all concentrations are given as the amino acid residue concentrations. Small chemical shift differences (≤∼0.04 ppm) could simply be explained by subtle sample variations (e.g., pH and ionic strength) rather than significant peptide-surfactant interactions.
FIGURE 13
FIGURE 13
(A) Number of bound β-C8G1 molecules per (KF)n monomers (β, ×) as determined by equilibrium dialysis and the fraction of (KF)n in α-helix conformation (Xα, ♦; determined by CD spectroscopy) as a function of free β-C8G1 concentration [Sfree]. (B) The number of bound β-C8G1 molecules per (KF)n amino acid monomers (β) as a function of the fraction of (KF)n in α-helix conformation (Xα) plotted for the same free β-C8G1 concentration.
FIGURE 14
FIGURE 14
Schematic view of the surfactant-peptide binding. The upper left panel illustrates the surfactant micelle-peptide binding above CMC, yielding an increased fraction of peptide in α-helix conformation. The enlargements of the β-C12G2 micelle and the (KF)n-β-C12G2 complex (lower left and right) are drawn to scale. Previously reported (72,73) dimensions of the oblate ellipsoid β-C12G2 micelle have been used. Thus, the radii of the hydrocarbon region (rsmall = 14.1 Å and rlarge = 28.2 Å) and the thickness of the headgroup region (6.2 Å) as well as the micelle aggregation number (132, assuming an unchanged aggregation number upon peptide binding) are taken from literature data on the “free” micelle. In the lower left panel, the peptide-micelle complex is sketched based on the NMR results and by using the number of amino acid (3.6) and the pitch (5.4 Å) per α-helix turn (74), and an approximate amino acid side-chain length (for a fully stretched chain) of 6 Å, assuming that the side-chain length of phenylalanine is the same as for lysine side chain as presented in the literature (75). For clarity, only part of the micelle and the peptide chain is drawn for the peptide-micelle complex in the lower left panel.

Similar articles

Cited by

References

    1. Kuroda, Y., Y. Maeda, S. Sawa, K. Shibata, K. Miyamoto, and T. Nakagawa. 2003. Effects of detergent on the secondary structures of prion protein peptides as studied by CD spectroscopy. J. Pept. Sci. 9:212–220. - PubMed
    1. Wieprecht, T., M. Beyermann, and J. Seelig. 1999. Binding of antibacterial magainin peptides to electrical neutral membranes: thermodynamics and structure. Biochemistry. 38:10377–10387. - PubMed
    1. Wieprecht, T., M. Beyermann, and J. Seelig. 2002. Thermodynamics of the coil-α-helix transition of amphipathic peptides in a membrande environment: the role of vesicle curvature. Biophys. Chem. 96:191–201. - PubMed
    1. Wieprecht, T., S. Rothemund, M. Bienert, and E. Krause. 2001. Role of helix formation for the retention of peptides in reversed-phase high-performance liquid chromatography. J. Chromatogr. A. 912:1–12. - PubMed
    1. Wieprecht, T., O. Apostolov, M. Beyermann, and J. Seelig. 2000. Interaction of a mitochondrial presequence with lipid membranes: role of helix formation for membrane binding and perturbation. Biochemistry. 39:15297–15305. - PubMed

Publication types

LinkOut - more resources