

Mass spectroscopic analysis of Sup35NM prion polymerization
- PMID: 16199512
- PMCID: PMC1366979
- DOI: 10.1529/biophysj.105.063875
Mass spectroscopic analysis of Sup35NM prion polymerization
Erratum in
- Biophys J. 2006 Jul 15;91(2):776
Abstract
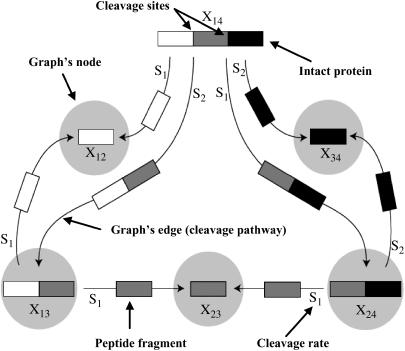
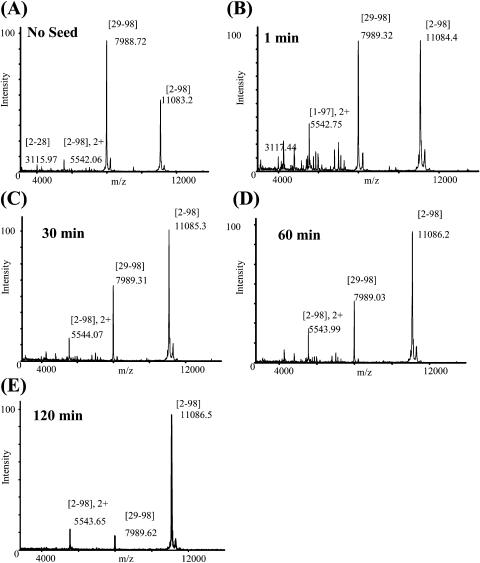
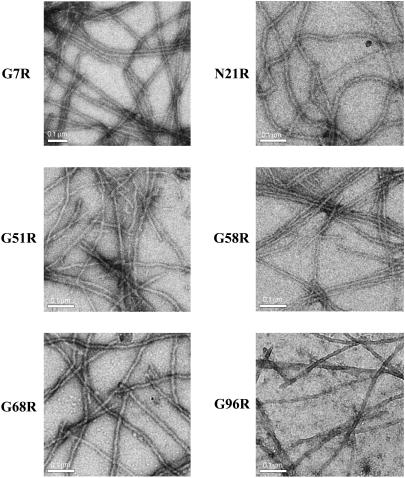
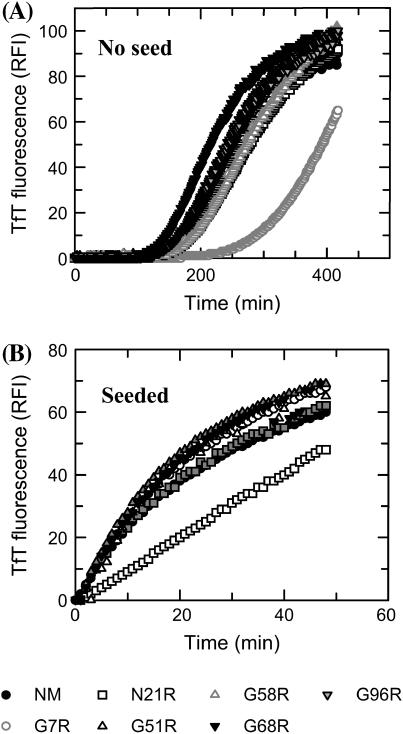
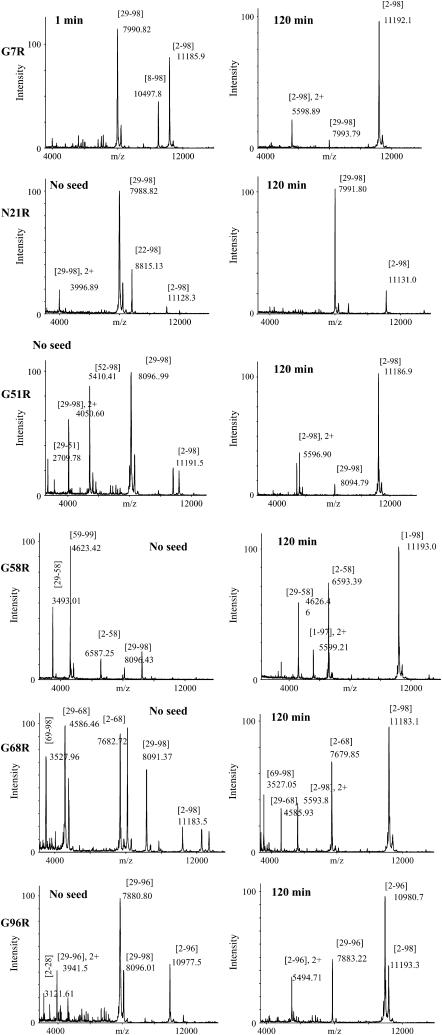
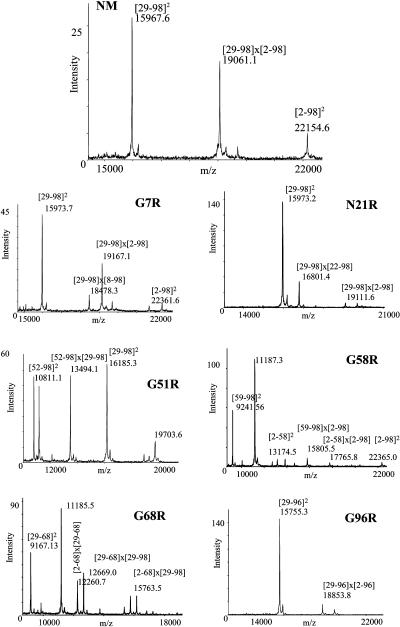
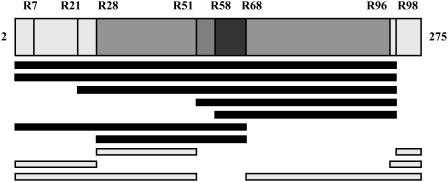
Sup35NM, the prion determining domain of the protein responsible for the yeast prion phenomenon [Psi], has become a powerful model for studying key processes in amyloid-related human diseases. One of these processes is a conformational conversion of soluble precursor protein into insoluble fibrillar structures. In this study, we created a set of Sup35NM mutants and used proteolytic digestion coupled with mass spectroscopy to monitor local structure of the protein during polymerization. Experimental data were compared to a network model and showed that during the conformational conversion residue Arg-28 became highly protected from cleavage, residue Arg-98 remained partially solvent exposed, and residues between 28 and 98 showed an intermediate degree of protection. In addition, we found that a distinct subset of proteolytic polypeptides spanning 28-98 residues segment spontaneously formed stable dimers. This finding suggests that the [29-98] region is the key interacting region of Sup35NM responsible for amyloid conversion.
Figures
Similar articles
-
Effects of randomizing the Sup35NM prion domain sequence on formation of amyloid fibrils in vitro.Biochem Biophys Res Commun. 2007 Feb 2;353(1):139-46. doi: 10.1016/j.bbrc.2006.11.143. Epub 2006 Dec 6. Biochem Biophys Res Commun. 2007. PMID: 17166483
-
Amyloid of the prion domain of Sup35p has an in-register parallel beta-sheet structure.Proc Natl Acad Sci U S A. 2006 Dec 26;103(52):19754-9. doi: 10.1073/pnas.0609638103. Epub 2006 Dec 14. Proc Natl Acad Sci U S A. 2006. PMID: 17170131 Free PMC article.
-
Influence of dendrimer's structure on its activity against amyloid fibril formation.Biochem Biophys Res Commun. 2006 Jun 23;345(1):21-8. doi: 10.1016/j.bbrc.2006.04.041. Epub 2006 Apr 24. Biochem Biophys Res Commun. 2006. PMID: 16674918
-
Amyloid oligomers: diffuse oligomer-based transmission of yeast prions.FEBS J. 2010 Mar;277(6):1359-68. doi: 10.1111/j.1742-4658.2010.07569.x. Epub 2010 Feb 9. FEBS J. 2010. PMID: 20148963 Review.
-
[Mechanism and application of molecular self-assembly in Sup35 prion domain of Saccharomyces cerevisiae].Sheng Wu Gong Cheng Xue Bao. 2011 Oct;27(10):1401-7. Sheng Wu Gong Cheng Xue Bao. 2011. PMID: 22260056 Review. Chinese.
References
Publication types
MeSH terms
Substances
LinkOut - more resources
Full Text Sources
Molecular Biology Databases
