Comparative Study
. 2005 Oct 11;102(41):14854-9.
doi: 10.1073/pnas.0504178102. Epub 2005 Sep 30.

A unique gene expression signature discriminates familial Alzheimer's disease mutation carriers from their wild-type siblings

Affiliations
Comparative Study

A unique gene expression signature discriminates familial Alzheimer's disease mutation carriers from their wild-type siblings

Yosuke Nagasaka et al. Proc Natl Acad Sci U S A. .

Abstract

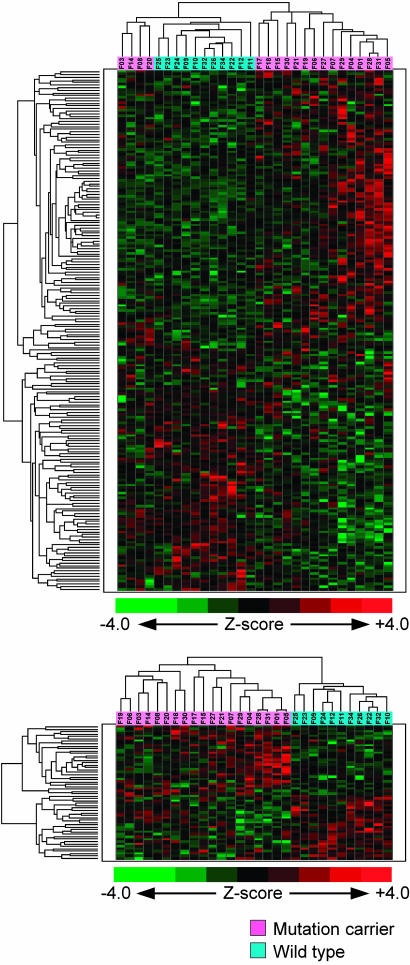
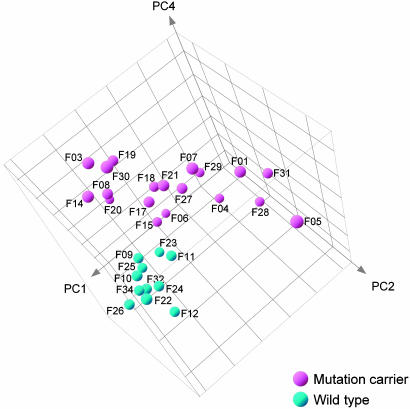
Alzheimer's disease (AD) is a neurodegenerative disease with an insidious onset and progressive course that inevitably leads to death. The current diagnostic tools do not allow for diagnosis until the disease has lead to irreversible brain damage. Genetic studies of autosomal dominant early onset familial AD has identified three causative genes: amyloid precursor protein (APP), presenilin 1 and 2 (PSEN1 and PSEN2). We performed a global gene expression analysis on fibroblasts from 33 individuals (both healthy and demented mutation carriers as well as wild-type siblings) from three families segregating the APP(SWE), APP(ARC) and PSEN1 H163Y mutations, respectively. The mutations cause hereditary progressive cognitive disorder, including typical autosomal dominant AD. Our data show that the mutation carriers share a common gene expression profile significantly different from that of their wild-type siblings. The results indicate that the disease process starts several decades before the onset of cognitive decline, suggesting that presymptomatic diagnosis of AD and other progressive cognitive disorders may be feasible in the near future.


Figures

Fig. 1.
Fig. 1.
A2 × 2 contingency table for calculation of Allen's CV criterion. The samples were divided into two categories, “High” or “Low,” depending on their signal intensity with respect to the midpoint of the signal intensity between the maximum value and the minimum value [(max + min)/2] of all samples. Samples that fall above the midpoint value were scored as High, and samples that fall below the midpoint value were scored as Low, i.e., upper and lower rows consist of samples with values higher and lower than the midpoint of the signal intensity, respectively. Left and right columns consist of samples that belong to class 1 (•) and class 2 (▴), respectively. Allen's CV criterion of the independent and the dependent models were calculated as log likelihoods.
Fig. 2.
Fig. 2.
Relationship between CV value and the number of differentially expressed genes and prediction accuracy. Illustration of how the number of identified probe sets and the prediction accuracy depend on the chosen CV threshold. Allen's CV value for each gene was calculated for wild-type samples versus mutation carriers as shown in Materials and Methods. The left y axis shows the number of genes having a greater CV value than the threshold indicated at the x axis (○). LOOCV was performed with SVM to evaluate the accuracy of prediction of genotype classification of the removed sample using the genes obtained at each CV threshold. The prediction accuracy is indicated on the right y axis (▪). CV threshold 3 corresponds to 200 genes, and threshold 4 corresponds to 56 genes.
Fig. 3.
Fig. 3.
Unsupervised hierarchical cluster analysis of the signal intensity value of 30 samples. Unsupervised hierarchical clustering of the 30 samples was performed by using the signal intensity for the probe sets obtained for CV thresholds exceeding 3 (200 genes) and 4 (56 genes). After transformation to Z score, two-dimensional unsupervised hierarchical clustering was performed with the cosign correlation as a similarity measure. Relative distances of each probe set (vertical axis) and sample (horizontal axis) are also demonstrated. The wild-type samples (blue) cluster together at both CV thresholds, whereas the mutation carriers (pink) have a higher similarity at CV threshold 4. Red and green indicate higher and lower expression, respectively.
Fig. 4.
Fig. 4.
PCA of the signal intensity for the 200 genes from 30 individuals. The signal intensity of 200 genes for each individual sample was subjected to PCA, and each sample is represented on a coordinate composed of first, second, and fourth principal component axes. The vectors thus obtained were used to derive a formula for calculating a FAD index that reflects the similarity to a mutation carrier (see text for details). Pink, mutation carriers; blue, wild type.

Similar articles

Cited by

References

    1. McKhann, G., Drachman, D., Folstein, M., Katzman, R., Price, D. & Stadlan, E. M. (1984) Neurology 34, 939-944. - PubMed
    1. World Health Organization (1992) The ICD-10 Classification of Mental and Behavioural Disorders: Clinical Descriptions and Diagnostic Guidelines (WHO, Geneva).
    1. American Psychological Association (1994) Diagnostic and Statistical Manual of Mental Disorders (Am. Psychol. Assoc., Washington, DC).
    1. Selkoe, D. J. & Podlisny, M. B. (2002) Annu. Rev. Genomics Hum. Genet. 3, 67-99. - PubMed
    1. Mullan, M., Crawford, F., Axelman, K., Houlden, H., Lilius, L., Winblad, B. & Lannfelt, L. (1992) Nat. Genet. 1, 345-347. - PubMed

Publication types