. 2005 Oct;187(20):6874-82.
doi: 10.1128/JB.187.20.6874-6882.2005.

Distinct constrictive processes, separated in time and space, divide caulobacter inner and outer membranes

Affiliations

Distinct constrictive processes, separated in time and space, divide caulobacter inner and outer membranes

Ellen M Judd et al. J Bacteriol. 2005 Oct.

Abstract

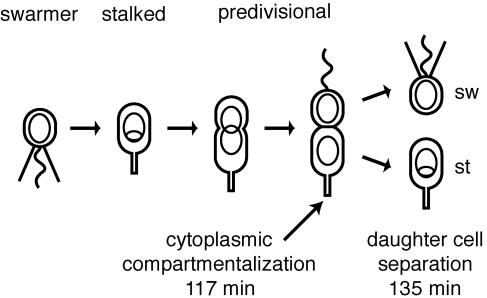
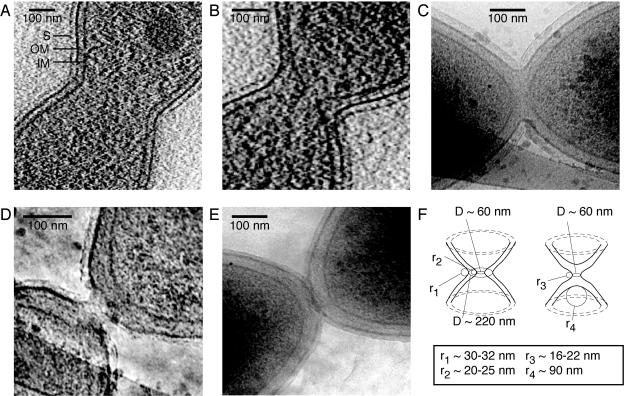
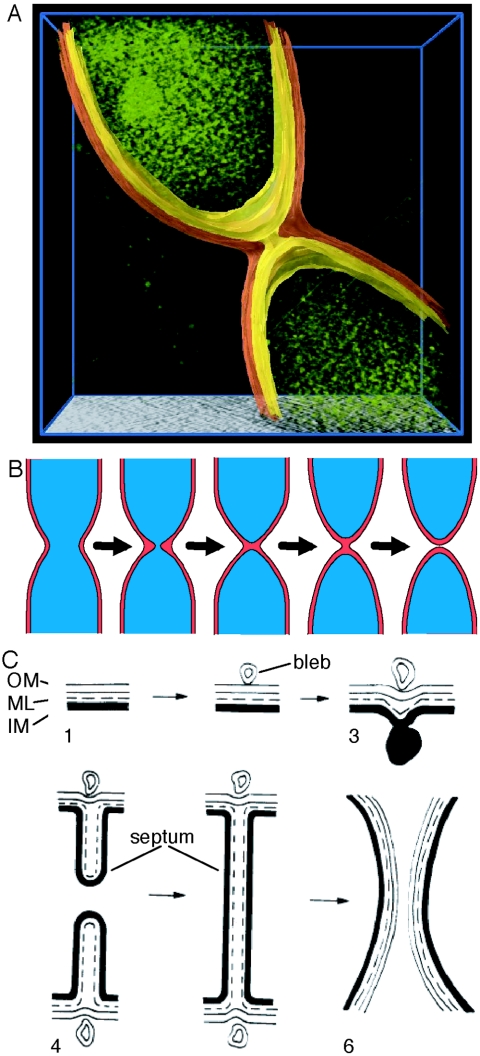
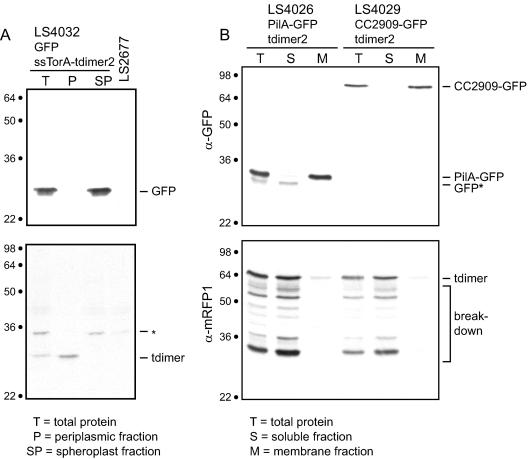
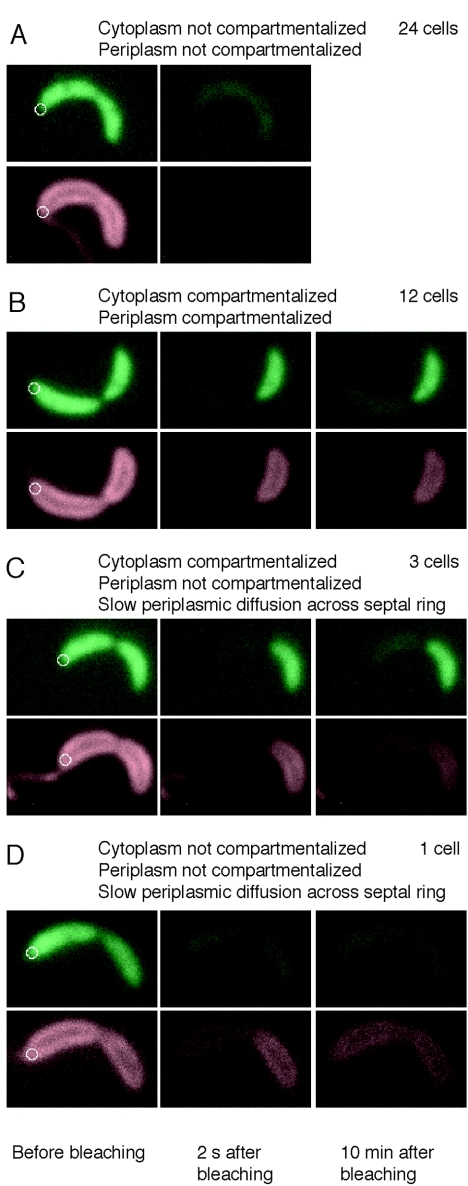
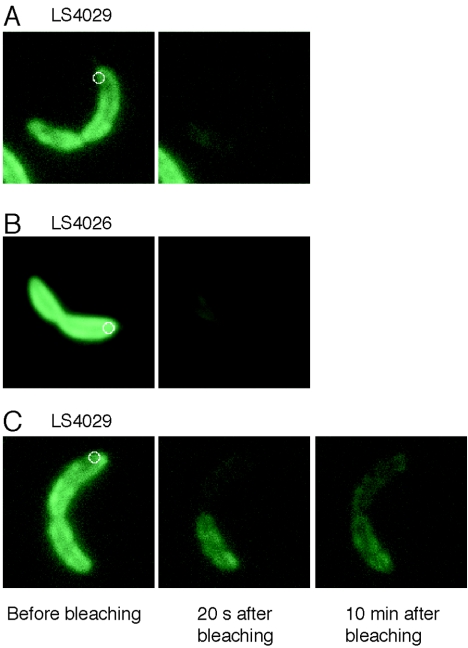
Cryoelectron microscope tomography (cryoEM) and a fluorescence loss in photobleaching (FLIP) assay were used to characterize progression of the terminal stages of Caulobacter crescentus cell division. Tomographic cryoEM images of the cell division site show separate constrictive processes closing first the inner membrane (IM) and then the outer membrane (OM) in a manner distinctly different from that of septum-forming bacteria. FLIP experiments had previously shown cytoplasmic compartmentalization (when cytoplasmic proteins can no longer diffuse between the two nascent progeny cell compartments) occurring 18 min before daughter cell separation in a 135-min cell cycle so the two constrictive processes are separated in both time and space. In the very latest stages of both IM and OM constriction, short membrane tether structures are observed. The smallest observed pre-fission tethers were 60 nm in diameter for both the inner and outer membranes. Here, we also used FLIP experiments to show that both membrane-bound and periplasmic fluorescent proteins diffuse freely through the FtsZ ring during most of the constriction procession.


Figures

FIG. 1.
FIG. 1.
Schematic of C. crescentus cell cycle. The motile swarmer (sw) cell has a polar flagellum (wavy line) and several pili (straight lines) and does not replicate its DNA (nonreplicating DNA represented as a ring). During differentiation into a stalked (st) cell, the flagellum is shed, the pili are retracted, a stalk is built at the same pole, and DNA replication initiates (theta structure). The stalked cell becomes a predivisional cell when it begins to constrict. Cell division yields a swarmer cell and a stalked cell.
FIG. 2.
FIG. 2.
CryoEM images of dividing Caulobacter cells. (A) Midcell slice of a tomogram of a predivisional cell showing rounded invagination forming at the division site. The inner (IM) and outer (OM) membranes are clearly visible, surrounded by the fainter image of the S layer (S). (B) Slice of a tomogram of a late-predivisional cell showing widening of the inner membrane-outer membrane spacing in the region of the constriction. The cytoplasm of the two nascent daughter cells is connected by a small tubular region. (C) Transmission EM image of a cell after fission of the inner membrane and additional constriction of the outer membrane. The continuity of the periplasmic space surrounding the newly separated cytoplasmic compartments is evident. (D) Transmission EM image of cell nearing fission of the outer membrane and cell separation. Restricted periplasmic diffusion may still be possible at this stage. (E) Divided cells. No division “scar” is visible at the poles of these cells. Note that we are assuming here that these two cells in close polar proximity are newly divided sibling cells, but we cannot be absolutely sure that they are not two older cells caught in close proximity at the instant of freezing. (F) Drawing illustrating the minimum observed constrictions and radii of curvature of the inner and outer membranes. The left drawing shows a cell with a highly constricted inner membrane and a less constricted outer membrane, as in panel B. r1 and r2 are the radii of curvature of the outer and inner membranes in this cell, respectively. The right drawing shows a cell in which the inner membrane has already separated and the outer membrane is highly constricted, as in panel D. r3 is the radius of curvature of the outer membrane in this cell. r4 is the radius of curvature of the separated inner membrane in the same cell.
FIG. 3.
FIG. 3.
(A) Three-dimensional rendering of a dividing cell just before inner membrane fission, constructed from the tomographic image data of the cell shown in Fig. 2B. The cytoplasm is shown in green, the inner membrane in yellow, and the outer membrane in orange. The 60-nm-diameter channel connecting the cytoplasm of the nascent daughter cells is clearly visible. The spots within the cytoplasm are localized sites of high absorption that may be ribosomes. (B) Schematic in consistent scale showing stages of cell division corresponding to Fig. 2A to E. Red, periplasm; blue, cytoplasm. (C) Schematic of the progression of Escherichia coli cell division (from Fig. 32 of the work of Burdett and Murray, 1974 [6]). OM, outer membrane; ML, murein layer; IM, inner membrane.
FIG. 4.
FIG. 4.
(A) ssTorA-tdimer2 is in the periplasmic fraction of Caulobacter cells. LS4032 cells were separated into periplasmic and spheroplast fractions as described in Materials and Methods. The total protein is also shown. These fractions were probed with an anti-GFP antibody (top panel) and with an anti-tdimer2 antibody (bottom panel). The tdimer2 protein is two copies of the dimeric red fluorescent protein dimer2 (8) fused with a polypeptide linker. There is a band in the periplasmic fraction the size of the dimer2 protein, indicating that the ssTorA-tdimer2 protein is exported to the periplasm of Caulobacter cells and then cleaved into two parts. LS2677 is a control strain containing no fluorescent proteins. The asterisk indicates a nonspecific band. (B) PilA-EGFP and CC2909-GFP are in the membrane fraction of Caulobacter cells. Cells containing pilA-EGFP (LS4026) and CC2909-EGFP (LS4029) were separated into membrane and soluble fractions as described in Materials and Methods. The total protein is also shown. These fractions were probed with an anti-GFP antibody (top panel) and with an anti-tdimer2 antibody (bottom panel). In strain LS4026, PilA-GFP is visible in the membrane fraction. A weaker and slightly smaller band (GFP*), presumably a breakdown product of PilA-GFP, is seen in the cytoplasmic fraction. Numbers on the left of each blot show approximate molecular masses in kDa.
FIG. 5.
FIG. 5.
Compartmentalization of the periplasm. Four representative FLIP experiments using strain LS4032, containing cytoplasmic EGFP and periplasmic ssTorA-tdimer2. Images are false colored; green represents the fluorescence signal from EGFP, and red represents the florescence signal from ssTorA-tdimer2. (A) A LS4032 cell before (left panels) and 2 s after (second-from-left panels) photobleaching. The cellwide loss of fluorescence in both channels indicates that neither the cytoplasm nor the periplasm is compartmentalized. (B) The same experiment performed on another cell. The right panel shows an image of the cell taken 10 min after photobleaching. In this case, retention of fluorescence in both channels in the portion of the cell distal to the focused laser beam shows that both the membrane and the cytoplasm of this cell are compartmentalized. (C) In this cell, the cytoplasm is compartmentalized but the periplasm is not, based on the picture taken 10 min after bleaching. (D) The cytoplasm of this cell is not compartmentalized. The periplasm appears to be compartmentalized in the image taken 2 s after bleaching. However, the image taken 10 min after bleaching shows that ssTorA-tdimer2 has diffused from the distal portion of the cell into the proximal portion, indicating that the periplasm is not fully compartmentalized. White circles: focused laser used for bleaching. The diameter of the circles is 0.4 μm, the full-width half-maximum size of the laser beam.
FIG. 6.
FIG. 6.
FLIP experiments on strains LS4026, containing PilA-EGFP (in the inner membrane) and cytoplasmic tdimer2, and LS4029, containing CC2909-EGFP (in the inner membrane) and cytoplasmic tdimer2. Images are false colored; green represents the fluorescence signal from CC2909-EGFP or PilA-EGFP. (A) shows a fluorescence image of a LS4029 cell before (left panels) and 20 seconds after (second-from-left panels) photobleaching. The cellwide loss of fluorescence indicates that CC2909-EGFP can diffuse past the constriction site. (B) The same experiment performed on a LS4026 cell. The cellwide loss of fluorescence indicates that PilA-EGFP can diffuse past the constriction site. (C) The same experiment performed on another LS4029 cell. The membrane appears to be compartmentalized in the image taken 20 s after bleaching. However, the image taken 10 min after bleaching shows that CC2909-EGFP has diffused from the distal portion of the cell into the proximal portion. The diameter of the circles is 0.4 μm, the full-width half-maximum size of the laser beam.

Comment in

References

    1. Addinall, S. G., and B. Holland. 2002. The tubulin ancestor, FtsZ, draughtsman, designer and driving force for bacterial cytokinesis. J. Mol. Biol. 318:219-236. - PubMed
    1. Addinall, S. G., and J. Lutkenhaus. 1996. FtsZ-spirals and -arcs determine the shape of the invaginating septa in some mutants of Escherichia coli. Mol. Microbiol. 22:231-237. - PubMed
    1. Ausmees, N., and C. Jacobs-Wagner. 2003. Spatial and temporal control of differentiation and cell cycle progression in Caulobacter crescentus. Annu. Rev. Microbiol. 57:225-247. - PubMed
    1. Bi, E. F., and J. Lutkenhaus. FtsZ ring structure associated with division in Escherichia coli. Nature 354:161-164, 1991. - PubMed
    1. Burdett, I. D. 1979. Electron microscope study of the rod-to-coccus shape change in a temperature-sensitive rod− mutant of Bacillus subtilis. J. Bacteriol. 137:1395-1405. - PMC - PubMed

Publication types

MeSH terms

Substances