. 2005 Oct;187(20):7103-18.
doi: 10.1128/JB.187.20.7103-7118.2005.

Transcriptional program of early sporulation and stationary-phase events in Clostridium acetobutylicum

Affiliations

Transcriptional program of early sporulation and stationary-phase events in Clostridium acetobutylicum

Keith V Alsaker et al. J Bacteriol. 2005 Oct.

Abstract

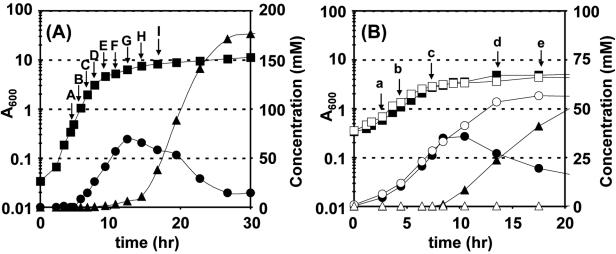
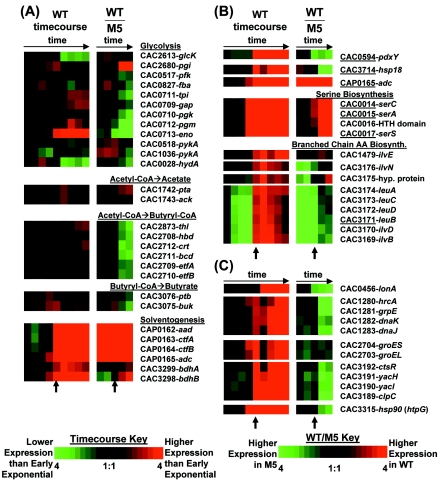
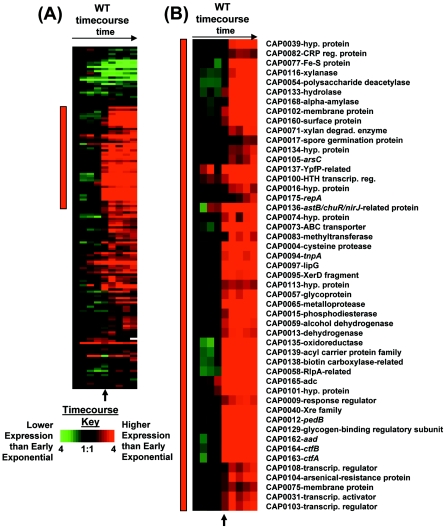
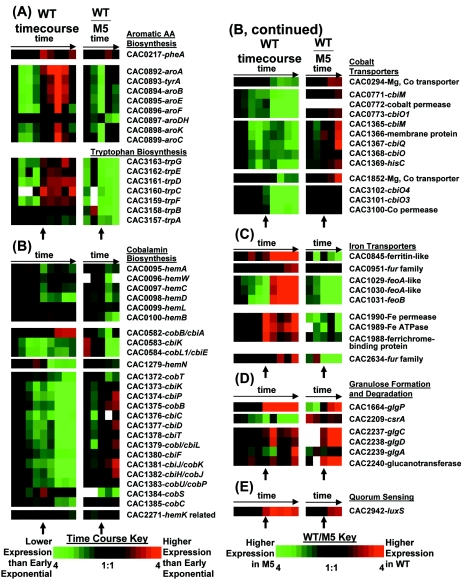
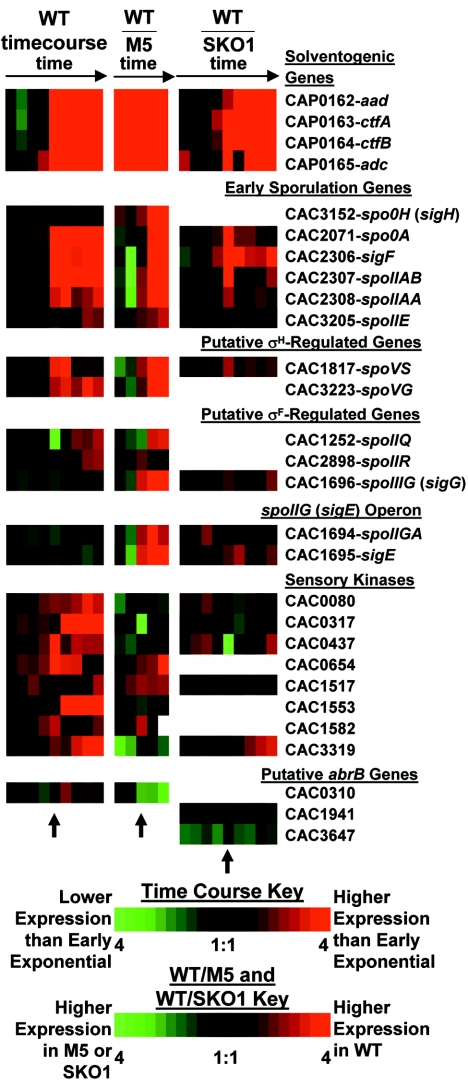
DNA microarray analysis of Clostridium acetobutylicum was used to examine the genomic-scale gene expression changes during the shift from exponential-phase growth and acidogenesis to stationary phase and solventogenesis. Self-organizing maps were used to identify novel expression patterns of functional gene classes, including aromatic and branched-chain amino acid synthesis, ribosomal proteins, cobalt and iron transporters, cobalamin biosynthesis, and lipid biosynthesis. The majority of pSOL1 megaplasmid genes (in addition to the solventogenic genes aad-ctfA-ctfB and adc) had increased expression at the onset of solventogenesis, suggesting that other megaplasmid genes may play a role in stationary-phase phenomena. Analysis of sporulation genes and comparison with published Bacillus subtilis results indicated conserved expression patterns of early sporulation genes, including spo0A, the sigF operon, and putative canonical genes of the sigma(H) and sigma(F) regulons. However, sigE expression could not be detected within 7.5 h of initial spo0A expression, consistent with the observed extended time between the appearance of clostridial forms and endospore formation. The results were compared with microarray comparisons of the wild-type strain and the nonsolventogenic, asporogenous M5 strain, which lacks the pSOL1 megaplasmid. While some results were similar, the expression of primary metabolism genes and heat shock proteins was higher in M5, suggesting a difference in metabolic regulation or a butyrate stress response in M5. The results of this microarray platform and analysis were further validated by comparing gene expression patterns to previously published Northern analyses, reporter assays, and two-dimensional protein electrophoresis data of metabolic genes (including all major solventogenesis genes), sporulation genes, heat shock proteins, and other solventogenesis-induced gene expression.


Figures

FIG. 1.
FIG. 1.
Growth curves and selected product concentrations for the WT fermentor (pH ≥5.0) culture time course (A) and the WT-M5 static flask (no pH control) comparison (B). WT results are represented by solid symbols, M5 results by open symbols. Squares, A600; circles, butyrate; triangles, butanol. Letters represent time points at which microarray analysis was performed; uppercase letters represent WT time course time points, lowercase letters represent WT-M5 time points.
FIG. 2.
FIG. 2.
Colorimetric expression profiles, or Eisen plots (20), of genes related to primary metabolism (A), genes whose protein products were previously identified as being differentially expressed during solventogenesis by Schaffer et al. (69) (B), and heat shock proteins (C) during the WT time course and WT-M5 comparison. Genes specifically identified by Schaffer and colleagues are underlined; other related genes, such as within a putative operon or functional group, have also been included. In panel A, genes are listed in the order of the reaction pathway. In panels B and C, putative operons are listed in the order of transcription. Short arrows beneath the Eisen plots denote the onset of stationary-phase gene expression (spo0A and aad-ctfA-ctfB expression).
FIG. 3.
FIG. 3.
Eisen plots of SOM clusters of gene expression in the WT time course (A) and WT-M5 comparison (B). The clusters are grouped by average-linkage hierarchical clustering to organize similar expression patterns. Distribution of gene functional groups across the clusters is represented colorimetrically next to the Eisen plots. Functional groups: C, energy production and conversion; D, cell division and chromosome partitioning; E, amino acid transport and metabolism; F, nucleotide transport and metabolism; G, carbohydrate transport and metabolism; H, coenzyme transport and metabolism; I, lipid transport and metabolism; J, translation, ribosomal structure, and biogenesis; K, transcription; L, DNA replication, recombination, and repair; M, cell wall and membrane biogenesis; N, cell motility and secretion; O, posttranslational modification, protein turnover, and chaperones; P, inorganic-ion transport and metabolism; Q, secondary-metabolite biosynthesis, transport, and catabolism; R, general function prediction; S, function unknown; T, signal transduction mechanisms; U, hypothetical protein; W, predicted membrane protein.
FIG. 4.
FIG. 4.
Expression profiles of 160 pSOL1 genes (A) and a selected cluster of upregulated genes (B). The red bar in panel A indicates the location of the selected genes in panel B. The arrow indicates the onset of solventogenesis and sporulation. The colorimetric scale is the same as in Fig. 2. White squares indicate that microarray signals were too close to the background to calculate a ratio. hyp., hypothetical; reg., regulatory; degrad., degrading; transcrip. reg., transcription regulator.
FIG. 5.
FIG. 5.
Expression profiles of selected genes related to aromatic amino acid biosynthesis (A), cobalamin biosynthesis and cobalt transport (B), iron transport (C), granulose formation and degradation (D), and quorum sensing (E). Arrows indicate the onset of solventogenesis and sporulation. The colorimetric scale is the same as in Fig. 2. White squares indicate that microarray signals were too close to the background to calculate a ratio.
FIG. 6.
FIG. 6.
Expression profiles of solventogenic and sporulation-related genes in the WT time course, the WT-M5 comparison, and the previously published WT-SKO1 comparison (83). Note that the expression ratios of the WT-SKO1 comparison are inverted with respect to the previously published values (83). The colorimetric scale is the same as in Fig. 2. White squares indicate that either microarray signals were too close to the background to calculate a ratio (all three experiments) or the gene was not present on the partial-genome microarray (83) (WT-SKO1 comparison only).

References

    1. Alen, C., and A. L. Sonenshein. 1999. Bacillus subtilis aconitase is an RNA-binding protein. Proc. Natl. Acad. Sci. USA 96:10412-10417. - PMC - PubMed
    1. Alsaker, K. V., C. J. Paredes, and E. T. Papoutsakis. Design, optimization and validation of genomic DNA microarrays for examining the Clostridium acetobutylicum transcriptome. Biotechnol. Bioprocess Eng., in press.
    1. Alsaker, K. V., T. R. Spitzer, and E. T. Papoutsakis. 2004. Transcriptional analysis of spo0A overexpression in Clostridium acetobutylicum and its effect on the cell's response to butanol stress. J. Bacteriol. 186:1959-1971. - PMC - PubMed
    1. Antoniewski, C., B. Savelli, and P. Stragier. 1990. The spoIIJ gene, which regulates early developmental steps in Bacillus subtilis, belongs to a class of environmentally responsive genes. J. Bacteriol. 172:86-93. - PMC - PubMed
    1. Baer, S. H., H. P. Blaschek, and T. L. Smith. 1987. Effect of butanol challenge and temperature on lipid composition and membrane fluidity of butanol-tolerant Clostridium acetobutylicum. Appl. Environ. Microbiol. 53:2854-2861. - PMC - PubMed

Publication types

MeSH terms

LinkOut - more resources