. 2005 Oct;25(20):8874-86.
doi: 10.1128/MCB.25.20.8874-8886.2005.

Nucleophosmin is required for DNA integrity and p19Arf protein stability

Affiliations

Nucleophosmin is required for DNA integrity and p19Arf protein stability

Emanuela Colombo et al. Mol Cell Biol. 2005 Oct.

Abstract

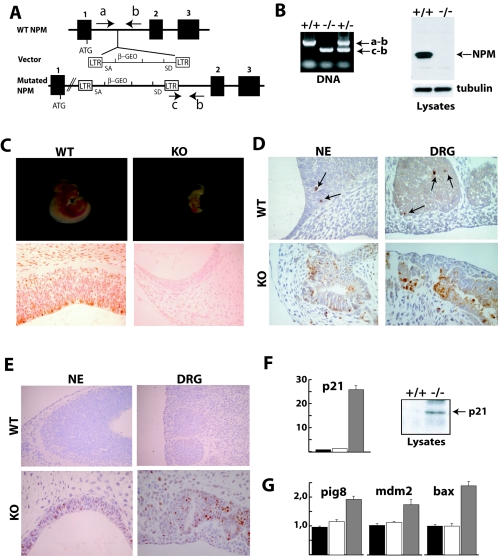
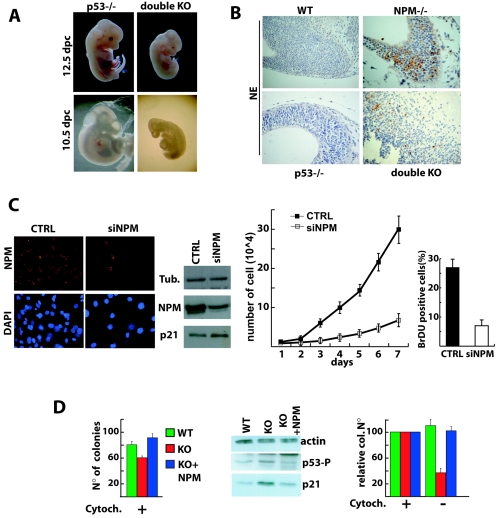
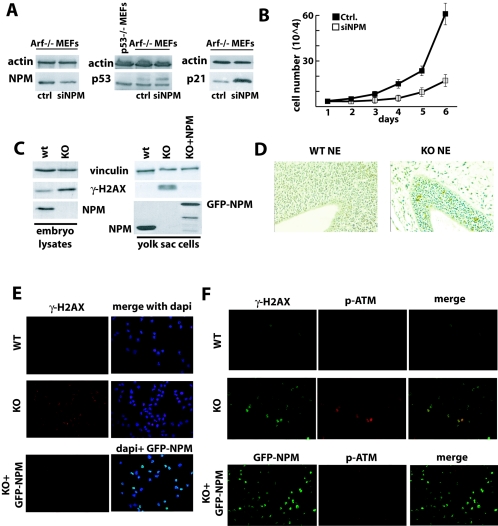
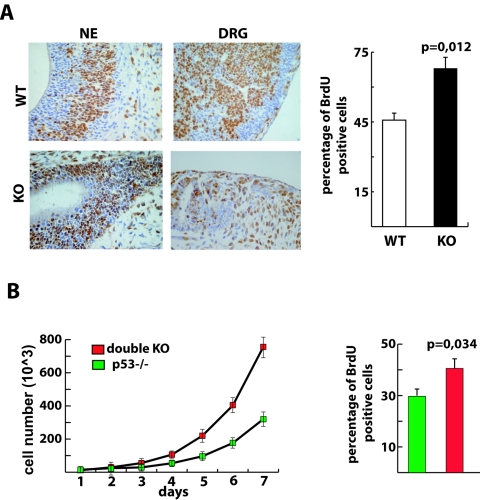
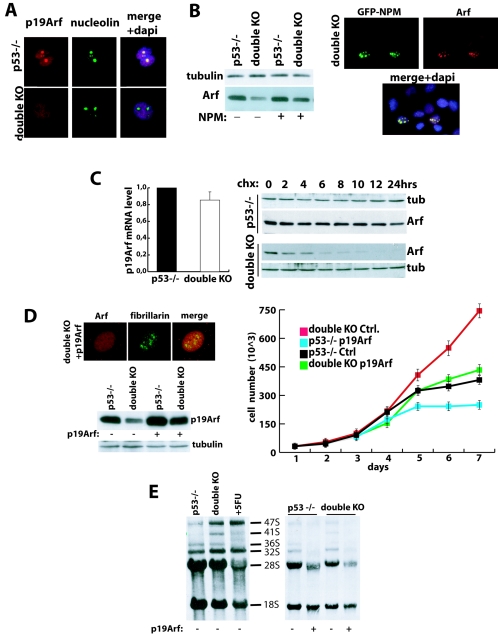
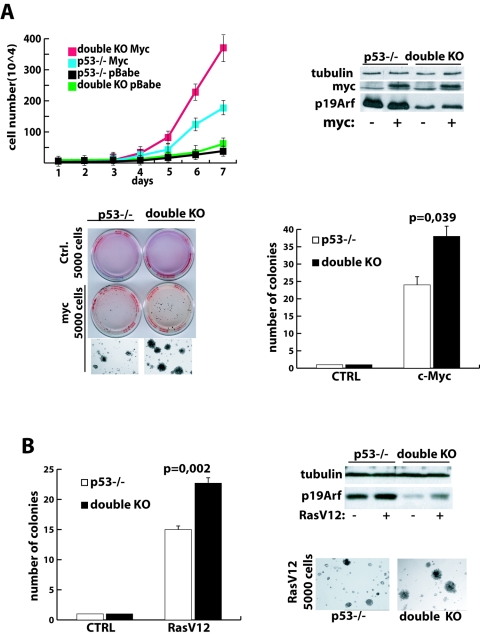
Nucleophosmin (NPM) is a nucleolar phosphoprotein that binds the tumor suppressors p53 and p19(Arf) and is thought to be indispensable for ribogenesis, cell proliferation, and survival after DNA damage. The NPM gene is the most frequent target of genetic alterations in leukemias and lymphomas, though its role in tumorigenesis is unknown. We report here the first characterization of a mouse NPM knockout strain. Lack of NPM expression results in accumulation of DNA damage, activation of p53, widespread apoptosis, and mid-stage embryonic lethality. Fibroblasts explanted from null embryos fail to grow and rapidly acquire a senescent phenotype. Transfer of the NPM mutation into a p53-null background rescued apoptosis in vivo and fibroblast proliferation in vitro. Cells null for both p53 and NPM grow faster than control cells and are more susceptible to transformation by activated oncogenes, such as mutated Ras or overexpressed Myc. In the absence of NPM, Arf protein is excluded from nucleoli and is markedly less stable. Our data demonstrate that NPM regulates DNA integrity and, through Arf, inhibits cell proliferation and are consistent with a putative tumor-suppressive function of NPM.


Figures

FIG. 1.
FIG. 1.
Gene trap event in the NPM locus leads to a null NPM mutation and early embryonic lethality in mice. (A) Schematic representation of the targeting retroviral construct (middle) and the wild-type (upper) or mutated (lower) NPM alleles. Positions of oligonucleotides used for the PCR-based genotyping (see panel B) are indicated by arrows (a, b, and c). LTR: long terminal repeats; SA: splicing acceptor site; SD: splicing donor sites; β-Geo: neomycin resistance gene. (B) Left panel: PCR analysis of embryos with the indicated NPM genotypes (primer pairs used are indicated on the right). Right panel: expression of NPM protein as determined by Western blotting of lysates prepared from whole embryos. A polyclonal antibody anti-NPM (Santa Cruz) was used. (C) Wild-type (WT) and knockout (KO) NPM embryos at 10.5 dpc of embryonic development (upper panels) and immunohistochemistry analysis of NPM expression in neuroepithelial (NE) sections from the same embryos, using NPMc antibodies (lower panels). (D and E) immunohistochemistry analysis of apoptosis (D; anti-caspase-3 staining) and p53 expression levels (E; anti-p53 staining) in the developing neuroepithelium and dorsal root ganglia (DRG) of wild-type NPM and knockout 10.5 dpc embryos. (F and G) Expression of p53 target genes analyzed by quantitative PCR (p21, Pig8, Mdm2, and Bax) using mRNA from wild-type NPM (black bars), heterozygous (white bars), and knockout (gray bars) embryos. (G) Western blotting analysis of p21 protein expression in total embryo lysates.
FIG. 2.
FIG. 2.
Loss of p53 gene rescues apoptosis in NPM knockout (KO) embryos. (A) p53−/− and double-knockout (p53−/− NPM−/−) embryos at different stages of development (10.5 and 12.5 dpc). (B) Analysis of apoptosis in the developing neuroepithelium (NE) of wild-type (WT), NPM−/−, p53−/− and double-knockout embryos. Immunohistochemistry analysis was performed using anti-activated caspase-3 antibody and counterstained with hematoxylin end eosin. (C) Down-regulation of NPM expression in wild-type MEFs by short interfering RNA. Cells were infected with a control (CTRL) lentivirus or a lentivirus expressing short interfering RNA for NPM (siNPM), as indicated, and analyzed by immunofluorescence using an anti-NPM antibody (NPMa) and by Western blot using anti-NPM and anti-p21 antibodies. For the growth curves, infected cells were seeded on six-well plates at a density of 104 cells per well. Cultures were harvested every day, and the number of cells was determined. The numbers refer to mean values of triplicate determinations. At day 3 of the growth curve, levels of BrdU incorporation were determined by FACS analysis (results refers to mean values of triplicate determinations). (D) Left panel: 2,000 cells derived from the yolk sac of knockout and wild-type embryos and knockout embryos reconstituted with GFP-NPM were seeded in semisolid medium supplemented with interleukin-3, interleukin-6, and stem cell factor and scored after 10 days for number of colonies. Middle panel: expression of phosphorylated p53 (anti-Ser18) and its target p21 in yolk sac-derived cells. Right panel: yolk sac-derived cells were cultured in suspension for 24 h, with (control) or without cytokines, and counted after 10 days (results are expressed as a percentage of the colonies obtained with control cells).
FIG. 3.
FIG. 3.
p53 activation in NPM null cells is part of a DNA damage response. (A) Western blots of lysates from the same cells as in panel B analyzed with antibodies against NPM, p21, and p53. (B) Growth curves of Arf−/− MEFs infected with a control lentivirus or a lentivirus expressing short interfering RNA for NPM (siNPM); 2 × 10⁴ cells were plated in six-well plates. Cultures were harvested every day, and the number of cells was determined. The numbers refer to mean values of triplicate determinations. (C) Western blotting analysis of γH2AX expression in lysates of total embryo and yolk sac cells. (D) Analysis of γH2AX expression in the developing brain of wild-type (WT) NPM and knockout (KO) 10.5 dpc embryos. Embryo sections were stained with a monoclonal antibody against the phosphorylated form of H2AX and counterstained with hematoxylin and eosin. (E and F) Immunofluorescence analysis of γH2AX and phosphorylated ATM (p-ATM) expression in wild-type and knockout yolk sac cells and in knockout cells reconstituted with GFP-NPM.
FIG. 4.
FIG. 4.
Loss of NPM leads to increased proliferation. (A) Left panel: immunohistochemistry analysis of proliferation (anti-BrdU staining) in the developing neuroepithelium and dorsal root ganglia (DRG) of wild-type (WT) NPM and knockout (KO) 10.5 dpc embryos. Right panel: evaluation of BrdU-positive cells in wild-type and knockout embryos through FACS analysis of cells derived directly from embryos after treatment with 0.1% collagenase. (B) Right panel: growth curves of p53−/− and double-knockout MEFs at passage 4 (2 × 10⁴ cells were plated into six-well plates). Cultures were harvested every day, and the total number of cells was determined. The numbers represent the mean values of triplicate determinations. The experiment was repeated twice, using two independently derived MEF cultures, and gave comparable results. Left panels: evaluation of BrdU-positive cells in growing p53−/− and double-knockout MEFs. Bars represent mean values of triplicate determinations. The experiments were repeated three times, giving comparable results.
FIG. 5.
FIG. 5.
Regulation of Arf stability and function by NPM. (A) Immunofluorescence analysis of p19Arf localization (red) in p53−/− and double-knockout (KO) MEFs. Nucleolin staining (green) was used as a marker for nucleoli. (B) Left panels: Western blotting analysis of p19Arf protein levels in p53−/− and double-knockout MEFs either under basal conditions or after infection with a GFP-NPM-expressing retrovirus (NPM). Right panels: immunofluorescence analysis of GFP-NPM localization in double-knockout MEFs (green) and its effect on endogenous p19Arf localization (red). (C) Left panel: p19Arf mRNA levels in p53−/− and double-knockout MEFs evaluated by quantitative PCR analysis (results are normalized against p53−/− RNA). Right panel: Western blotting analysis of p19Arf protein stability in p53−/− and double-knockout MEFs. MEFs were treated with cycloheximide (chx) to block protein synthesis and analyzed at the indicated time points after wash-out. As an internal control, the same lysates were probed with antibodies against tubulin, which is stable over the 24 h of the experimental procedure. (D) Upper left panel: immunofluorescence analysis of double-knockout MEFs infected with a p19Arf-expressing retroviruses. Lower left panel: Western blotting analysis of p19Arf protein levels in double-knockout and p53−/− MEFs infected with a control retrovirus or a retrovirus expressing p19Arf. Right panel: growth curves of p53−/− and double-knockout MEFs infected with a control retrovirus or a retrovirus expressing p19Arf; 2 × 10⁴ cells were plated into six-well plates and counted at daily intervals. Numbers refer to the mean values of triplicate determinations. (E) Evaluation of newly synthesized rRNA by pulse-chase labeling with [3H]uridine in uninfected double-knockout and p53−/− MEFs (left panel) or upon infection with a control retrovirus or with a p19Arf-expressing retrovirus (right panel). Double-knockout MEFs were treated with 5-fluorouracil (5FU), as indicated. The different rRNA species, as detected by autoradiography, are indicated between the two panels.
FIG. 6.
FIG. 6.
Effects of NPM expression on transformation by Myc and Ras. (A) p53−/− and double-knockout (KO) MEFs were infected with a control retrovirus or a retrovirus expressing the c-myc oncogene. At the end of the selection, 2 × 10⁴ cells were plated into six-well plates and cells were counted at daily intervals. The numbers refer to the mean values of triplicate determinations. The same cells were analyzed by Western blotting using antibodies against tubulin, p19Arf and Myc (right upper panel) and plated in semisolid medium (in triplicate). The number of colonies (right lower panel) and representative plates and colonies (left lower panels) are shown. (C) Same experiment as described for panel A, using a retrovirus expressing the RasV12 oncogene. We evaluated tubulin and p19Arf protein levels (right upper panel) and numbers of colonies formed after plating in semisolid medium (left panel). Representative colonies are also shown (right lower panel).

Similar articles

Cited by

References

    1. Bartek, J., C. lukas, and J. Lukas. 2004. Checking on DNA damage in S phase. Nat. Rev. Mol. Cell. Biol. 5:792-804. - PubMed
    1. Bartkova, J., Z. Horejsi, K. Koed, A. Kramer, F. Tort, K. Zieger, P. Guldberg, M. Sehested, J. M. Nesland, C. Lukas, T. Orntoft, J. Lukas, and J. Bartek. 2005. DNA damage response as a candidate anti-cancer barrier in early human tumorigenesis. Nature 434:864-870. - PubMed
    1. Bertwistle, D., M. Sugimoto, and C. J. Sherr. 2004. Physical and functional interactions of the Arf tumor suppressor protein with nucleophosmin/B23. Mol. Cell. Biol. 24:985-996. - PMC - PubMed
    1. Borer, R. A., C. F. Lehner, H. M. Eppenberger, and E. A. Nigg. 1989. Major nucleolar proteins shuttle between nucleus and cytoplasm. Cell 56:379-390. - PubMed
    1. Borggrefe, T., M. Wabl, A. T. Akhmedov, and R. Jessberger. 1998. A B-cell-specific DNA recombination complex. J. Biol. Chem. 273:17025-17035. - PubMed

Publication types

MeSH terms