Comparative Study
. 2005 Dec;6(12):1208-13.
doi: 10.1038/sj.embor.7400538.

Environments shape the nucleotide composition of genomes

Affiliations
Comparative Study

Environments shape the nucleotide composition of genomes

Konrad U Foerstner et al. EMBO Rep. 2005 Dec.

Abstract

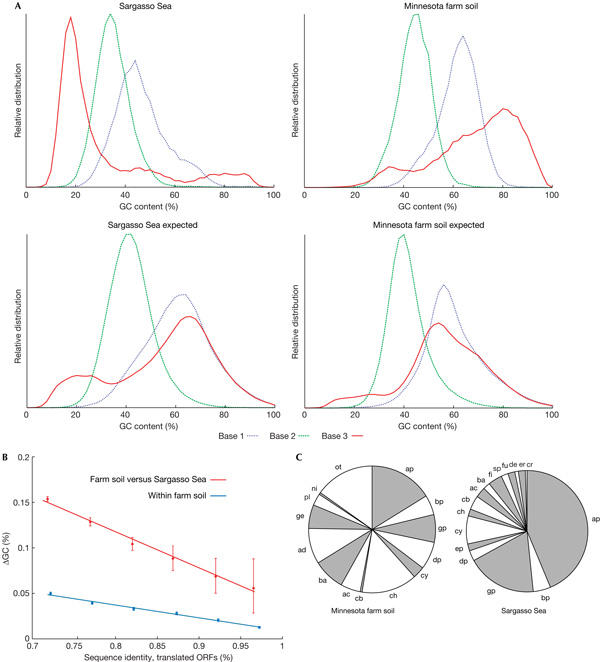
To test the impact of environments on genome evolution, we analysed the relative abundance of the nucleotides guanine and cytosine ('GC content') of large numbers of sequences from four distinct environmental samples (ocean surface water, farm soil, an acidophilic mine drainage biofilm and deep-sea whale carcasses). We show that the GC content of complex microbial communities seems to be globally and actively influenced by the environment. The observed nucleotide compositions cannot be easily explained by distinct phylogenetic origins of the species in the environments; the genomic GC content may change faster than was previously thought, and is also reflected in the amino-acid composition of the proteins in these habitats.


Figures

Figure 1
Figure 1
Guanine and cytosine content of environmental sequences. Guanine and cytosine content distributions and predicted frequencies of amino acids in four environments (eight subsamples in total, all containing >90% prokaryotic species), compared with completely sequenced prokaryotic genomes grouped into phyla and subphyla. The trees depict the relationships between the samples (Tringe et al, 2005), and between phyla and subphyla to which the genomes belong. The number of sequenced genomes available for each taxonomic group is given in parentheses. Only phyla with at least three completely sequenced genomes have been included, and only those environmental sequence fragments that contain at least one predicted open reading frame with significant similarity to a known gene (60 bits or better) are shown. (A) Relative distributions of Guanine and cytosine (GC) content values, averaged over individual sequence reads. For comparability, virtual reads were generated for completely sequenced genomes. The darker the colour, the higher the number of reads with the respective GC content. Vertical dashed lines denote the average value of each sample/group. (B) Comparison of the GC distribution of Sargasso Sea reads (subsamples #2–#4) with (i) a subset that contains only translation genes occurring once per genome and (ii) with a simulated sample derived from completely sequenced genomes and selected to contain the same distribution of phyla. Translation genes show a distribution similar to the whole set, indicating that no bias is introduced by gene content (larger genomes may contain many genes with unusual GC content); the deviation from the simulated sample shows that GC content is apparently not always a simple function of the broad phylogenetic distribution of the species in an environment. (C) Frequencies of the amino acids lysine and alanine among encoded proteins. Notice the dependency on GC content (for other amino acids, as well as a compound index, see supplementary Table 1 online).
Figure 2
Figure 2
Guanine and cytosine content analysis of open reading frames. (A) Deviation from expectation. Guanine and cytosine (GC) content distributions are shown for each environmental sample, separately for each codon position. The curves are compared with the expected distributions; the latter were derived from known genomes by sampling their DNA in amounts matching the overall phylogenetic compositions reported for the samples. (B) GC-content differences for paired open reading frames (ORFs) of high sequence similarity (that is, recent divergence). ORFs were paired on the basis of reciprocal best matches in BLAST searches (see supplementary Figure 3 online for more details). Error bars denote 90% confidence intervals of the mean. (C) Phylogenetic distributions of organisms, as reported from 16S ribosomal RNA analysis, for two principal samples. Note the wide range of phyla present. ac, Actinobacteria; ad, Acidobacteria; ap, α-Proteobacteria; ba, Bacteriodetes; bp, β-Proteobacteria; cb, Chlorobi; ch, Chloroflexi; cr, Crenarchaeota; cy, Cyanobacteria; de, Deinococcus-Thermus; dp, δ-Proteobacteria; ep, ɛ-Proteobacteria; er, Eryarchaeota; fi, Firmicutes; fu, Fusobacteria; ge, Gemmatimonadetes; gp, γ-Proteobacteria; ni, Nitrospira; ot, others; pl, Planctomycetes; sp, Spirochaetes.

Similar articles

Cited by

References

    1. Bentley SD, Parkhill J (2004) Comparative genomic structure of prokaryotes. Annu Rev Genet 38: 771–792 - PubMed
    1. Bharanidharan D, Bhargavi GR, Uthanumallian K, Gautham N (2004) Correlations between nucleotide frequencies and amino acid composition in 115 bacterial species. Biochem Biophys Res Commun 315: 1097–1103 - PubMed
    1. Delong EF (2005) Microbial community genomics in the ocean. Nat Rev Microbiol 6: 459–469 - PubMed
    1. Fickett JW (1995) ORFs and genes: how strong a connection? J Comput Biol 2: 117–123 - PubMed
    1. Foster PG, Jermiin LS, Hickey DA (1997) Nucleotide composition bias affects amino acid content in proteins coded by animal mitochondria. J Mol Evol 44: 282–288 - PubMed

Publication types