

doi: 10.1080/08998280.2005.11928025.
Diagnostic molecular pathology, part 2: proteomics and clinical applications of molecular diagnostics in hematopathology
Affiliations
- PMID: 16200142
- PMCID: PMC1200694
- DOI: 10.1080/08998280.2005.11928025
Item in Clipboard
Diagnostic molecular pathology, part 2: proteomics and clinical applications of molecular diagnostics in hematopathology
Proc (Bayl Univ Med Cent).
2005 Jan.
No abstract available
Figures
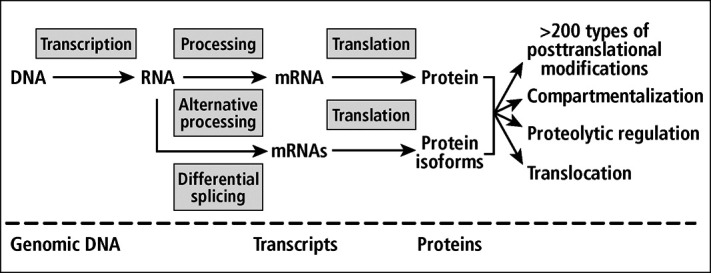
Different epigenetic processes that may lead to physically and/or functionally variable forms of protein isoforms from a single gene sequence. Reprinted with permission from reference .
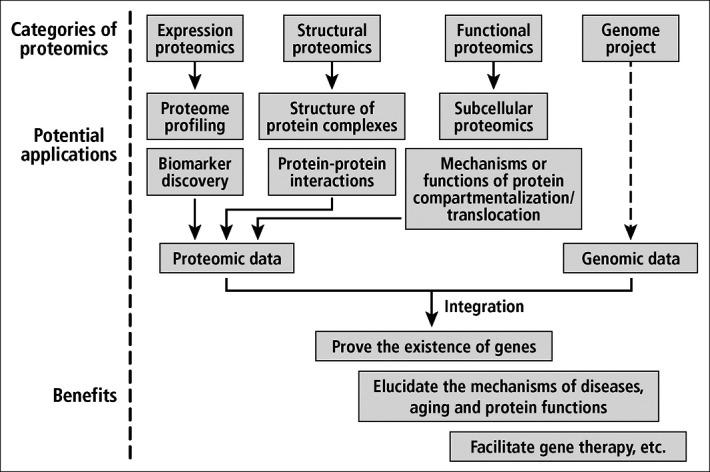
Proteomics and genomics integration. The integration of data will have a synergistic effect on biologic discovery. Reprinted with permission from reference .
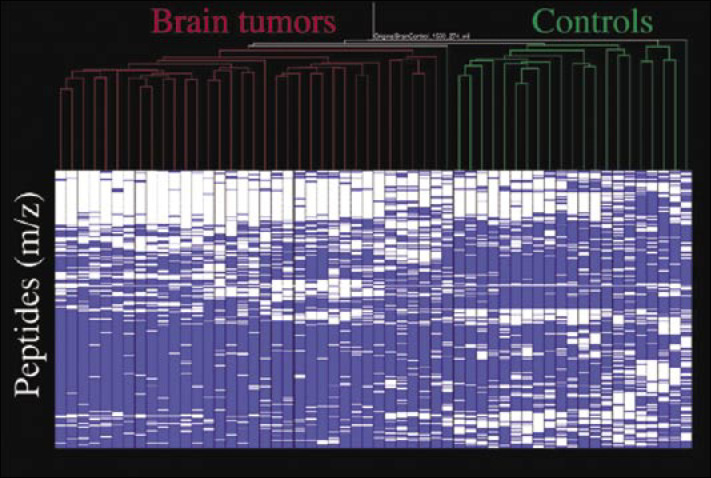
Proteomic fingerprints of the sera of 32 patients with glioblastoma multiforme compared with 22 controls using mass spectrometry. Expression patterns of 274 informative peptides are depicted using hierarchical clustering. Reprinted with permission from reference . Copyright 2004 American Chemical Society.
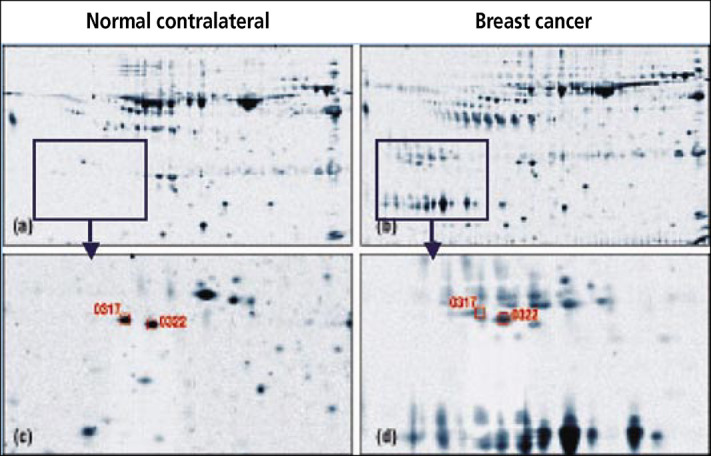
Proteomic analysis of nipple aspirate fluids using two-dimensional gel electrophoresis. Spots in the bottom panel (enlarged from the top panel) indicate proteins expressed solely by nipple aspirate fluids from breasts containing tumor and not by the contralateral control breast. Copyright 2002 American Cancer Society. Reprinted from reference by permission of Wiley-Liss, Inc., a subsidiary of John Wiley & Sons, Inc.
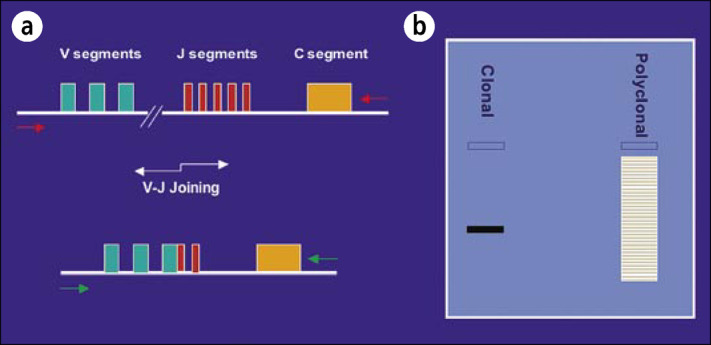
(a) Schematic depiction of immunoglobulin heavy-chain gene rearrangement studies by polymerase chain reaction. (b) Results of agarose gel electrophoresis. A solid black (clonal) band indicates a positive reaction, whereas the smear of faint bands on the right indicates a reactive inflammatory polyclonal process.
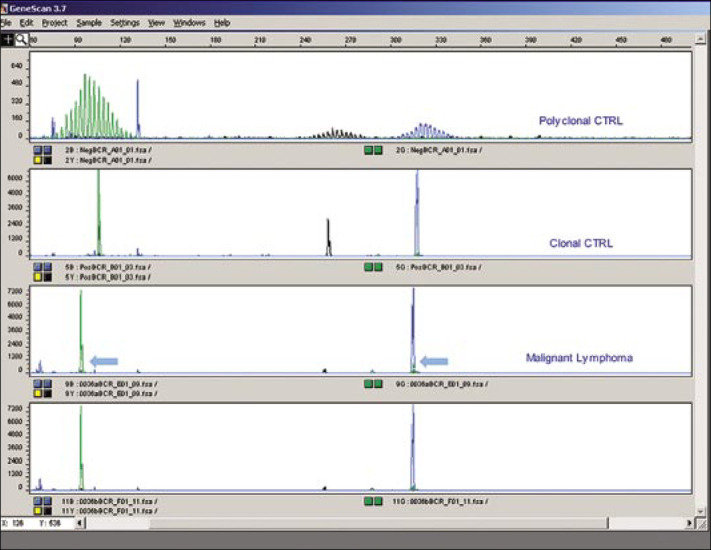
Results of capillary electrophoresis of the immunoglobulin heavy-chain gene rearrangement polymerase chain reaction assay. The third row (arrows) and fourth row illustrate clonal peaks similar to the clonal control (second row), supporting a diagnosis of malignant B-cell lymphoma in this paraffin-embedded sample from a lymph node biopsy.
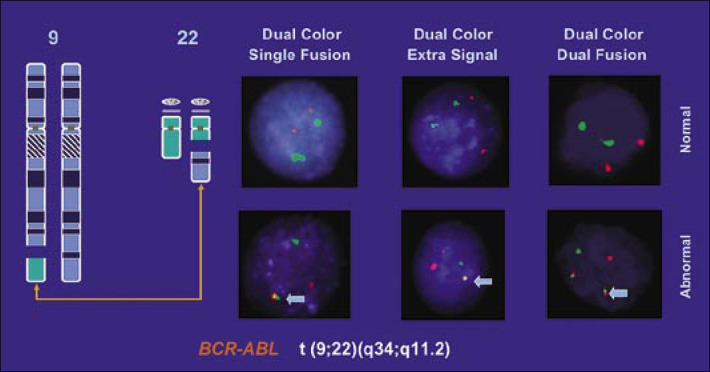
Fluorescence in situ hybridization analysis for BCR-ABL chromosomal translocations. A yellow signal in columns 1 and 2 and a green-red fusion signal in column 3 indicate a positive test. Modified with permission from Abbott Diagnostics.
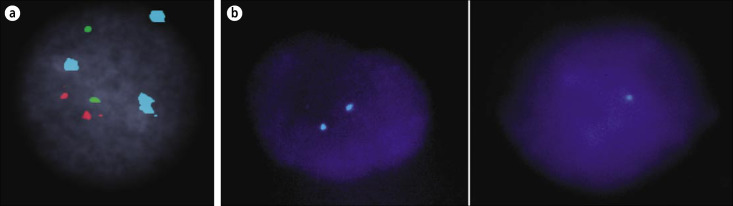
Fluorescence in situ hybridization prognostic markers in chronic myelogenous leukemia. (a) A nucleus showing trisomy 8 (3 aqua), while BCR-ABL ES fusion is negative (two green; two red). Reprinted from reference with permission from the International Society for Experimental Hematology. (b) Fluorescence in situ hybridization LSI 9q34. The normal cell (left) shows two intact copies of chromosome 9 (two aqua signals), and the abnormal cell (right) shows loss of one of the 9q34 signals. Reprinted with permission from Abbott Diagnostics.
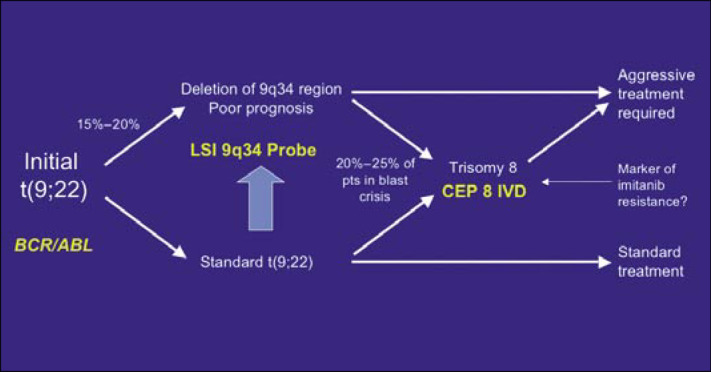
Schematic of the utility of fluorescence in situ hybridization in the treatment and prognostication of chronic myelogenous leukemia. Modified with permission from Abbott Diagnostics.
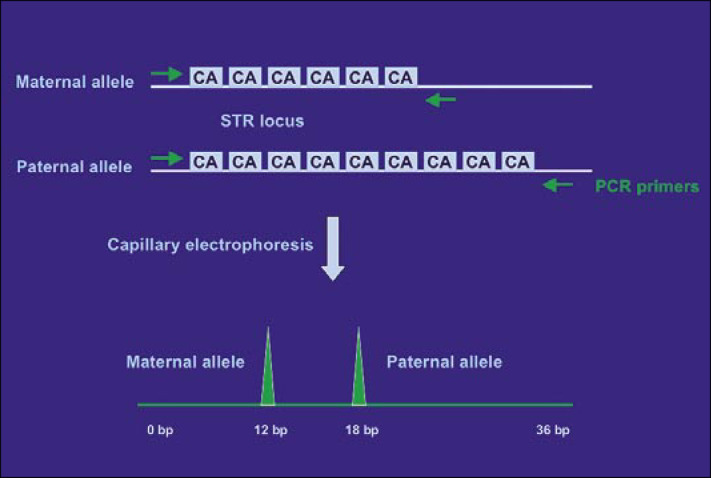
Schematic of short tandem repeat markers. In this heterozygous example, differences in the number of CA repeats (6 vs 9) between the two alleles result in two distinct polymerase chain reaction peaks by capillary electrophoresis. These peaks can be used as genetic markers of this individual identity.
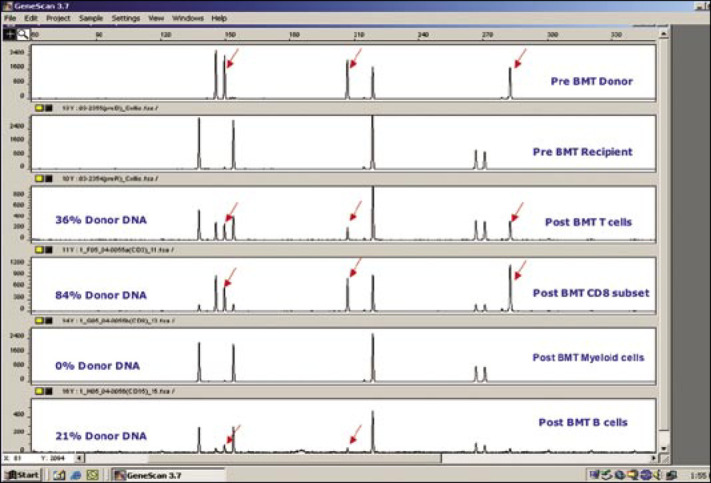
Evaluation of engraftment by short tandem repeat analysis after bone marrow transplantation. Peripheral blood leukocyte subpopulations were analyzed (rows 3, 4, 5, 6). Arrows indicate informative peaks that distinguish donor and recipient identity; these peaks can be useful in evaluating the source of leukocytes in blood samples after transplantation.
Similar articles
-
Recommended curriculum for teaching hematopathology to subspecialty hematopathology fellows.Am J Clin Pathol. 2007 Jun;127(6):962-76. doi: 10.1309/6C41Q30M5RM83QMH. Am J Clin Pathol. 2007. PMID: 17509994
-
Pitfalls in diagnostic hematopathology: part I.Int J Clin Exp Pathol. 2009;2(1):11-20. Epub 2008 Apr 21. Int J Clin Exp Pathol. 2009. PMID: 18830390 Free PMC article.
-
Five important advances in hematopathology.Arch Pathol Lab Med. 2014 Mar;138(3):410-9. doi: 10.5858/ARPA.2012-0645-RA. Arch Pathol Lab Med. 2014. PMID: 24576034 Review.
-
Molecular diagnostics.Hematology Am Soc Hematol Educ Program. 2003:279-93. doi: 10.1182/asheducation-2003.1.279. Hematology Am Soc Hematol Educ Program. 2003. PMID: 14633786 Review.
-
New transcription factors in diagnostic hematopathology.Adv Anat Pathol. 2007 Jan;14(1):25-35. doi: 10.1097/PAP.0b013e31802f0495. Adv Anat Pathol. 2007. PMID: 17198308 Review.
Cited by
-
Cell-blocks and other ancillary studies (including molecular genetic tests and proteomics).Cytojournal. 2021 Feb 22;18:4. doi: 10.25259/Cytojournal_3_2021. eCollection 2021. Cytojournal. 2021. PMID: 33880127 Free PMC article. Review.
-
Pseudo-HE images derived from CARS/TPEF/SHG multimodal imaging in combination with Raman-spectroscopy as a pathological screening tool.BMC Cancer. 2016 Jul 26;16:534. doi: 10.1186/s12885-016-2520-x. BMC Cancer. 2016. PMID: 27460472 Free PMC article.
References
-
- Liotta L, Kohn EC, Petricoin EF. Clinical proteomics: personalized molecular medicine. JAMA. 2001;286:2211–2214. - PubMed
-
- Lau AT, He QY, Chiu JF. Proteomic technology and its biomedical applications. Acta Biochemica. 2003;35:965–975. - PubMed
-
- Hanash SM, Bobek MP, Rickman DS, Williams T, Rouillard JM, Kuick R, Puravs E. Integrating cancer genomics and proteomics in the post-genome era. Proteomics. 2002;2:69–75. - PubMed
-
- Merchant M, Weinberger SR. Recent advancements in surface-enhanced laser desorption/ionization-time of flight-mass spectrometry. Electrophoresis. 2000;21:1164–1177. - PubMed
LinkOut - more resources
Full Text Sources