

doi: 10.1002/jcc.20290.
The Amber biomolecular simulation programs
Affiliations
- PMID: 16200636
- PMCID: PMC1989667
- DOI: 10.1002/jcc.20290
Item in Clipboard
The Amber biomolecular simulation programs
J Comput Chem.
2005 Dec.
Abstract
We describe the development, current features, and some directions for future development of the Amber package of computer programs. This package evolved from a program that was constructed in the late 1970s to do Assisted Model Building with Energy Refinement, and now contains a group of programs embodying a number of powerful tools of modern computational chemistry, focused on molecular dynamics and free energy calculations of proteins, nucleic acids, and carbohydrates.
(c) 2005 Wiley Periodicals, Inc.
Figures
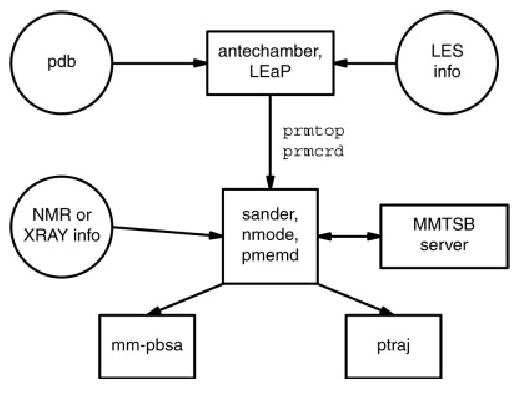
Information flow in the Amber program suite.
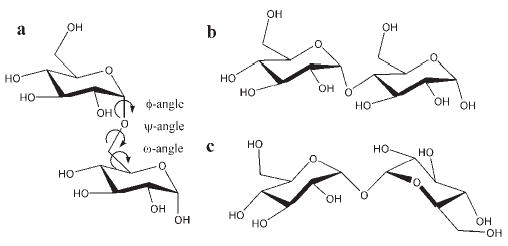
Illustration of 3 of the 10 possible disaccharides generated from linking two α-D-glucopyranosyl residues (α-D-glcp): (a) α-D-glcp-(1→6)-α-D-glcp (iso-maltose), (b) α-D-glcp-(1→4)-α-D-glcp (maltose), and (c) α-D-glcp-(1→1)-α-D-glcp (α,α-trehalose). Conformation-determining glycosidic torsion angles are indicated in (a).
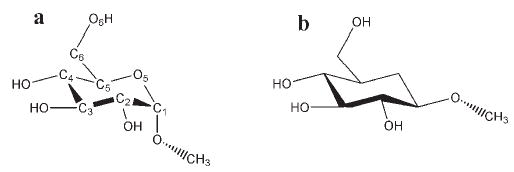
Numbering and anomeric configuration in (a) methyl α- and (b) methyl β-D-glucopyranoside. In GLYCAM, anomeric carbon atom C1 is atom type AC in (a) and atom type EC in (b); in GLYCAM04 both are atom type CG.
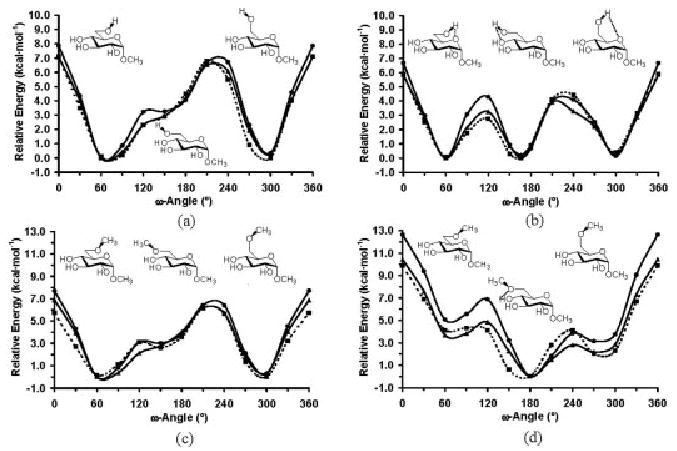
HF/6-31G(d), B3-LYP/6-31++G(2d,2p), and GLYCAM ω-angle rotational curves for methyl α-D-glucopyranoside, without (a) and with (b) internal hydrogen bonding; and methyl 6-O-methyl-α-D-glucopyranoside, without (c) and with (d) internal hydrogen bonding.
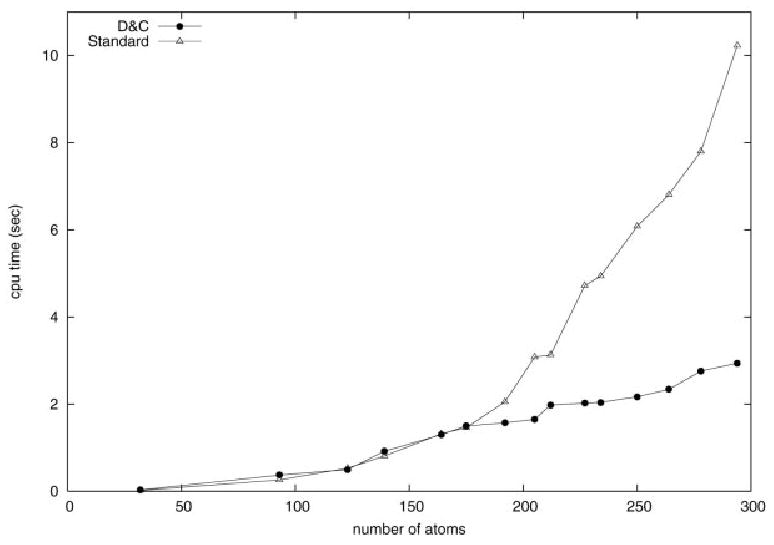
Timings for semiempirical calculations of chymotrypsin, as a function of the size of the QM region.
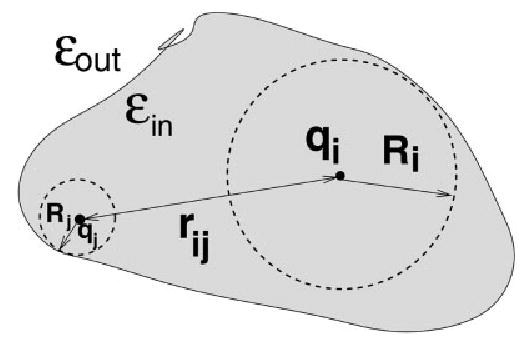
The effective Born radius of an atom reflects the degree of its burial inside the low dielectric region defined by the solvent boundary.
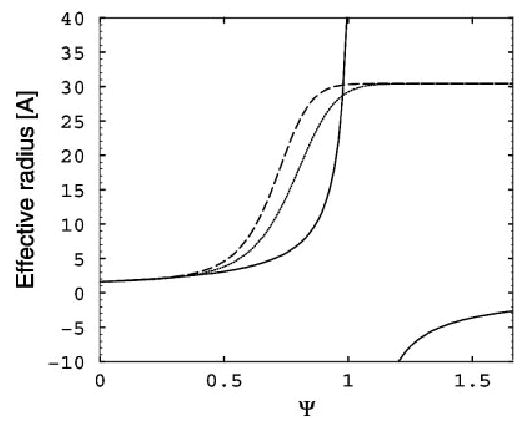
Graphical representation of different expressions used to compute the effective Born radius from the scaled volume Ψ. The broken lines correspond to eq. (8) of the GBOBC model, with parameters corresponding to igb = 2 (dashed) and igb = 5 (dotted). The GBHCT model (corresponding to igb = 1 in Amber) is shown as a solid line. All curves are computed for ρi = 1.7 Å.
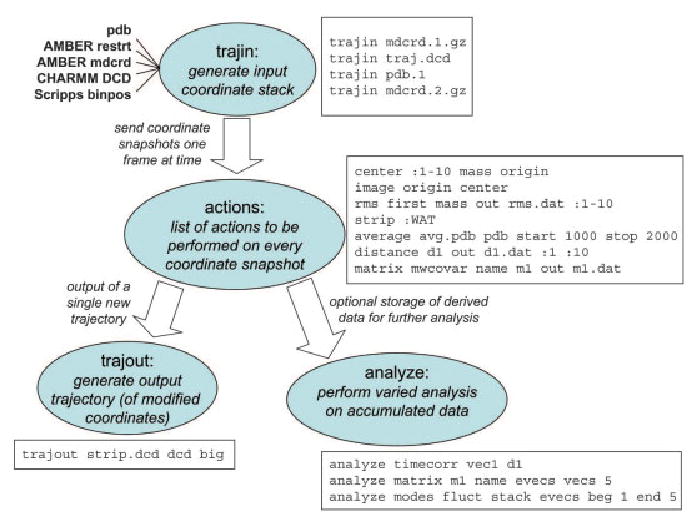
Information flow in ptraj. [Color figure can be viewed in the online issue, which is available at http://www.interscience.wiley.com .]
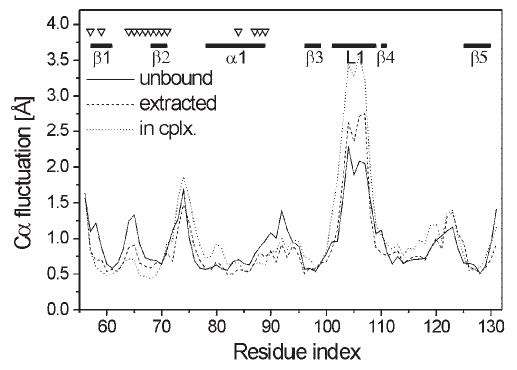
Cα atom root-mean-square atomic fluctuations of Raf in unbound (solid line) and bound (using least-squares fitting of bound, yet extracted, Raf conformations only: dashed line; using least-squares fitting of the whole Ras–Raf complex: dotted line) state. Residues in the interface region are marked with ▽, secondary structure elements are indicated by bold lines.
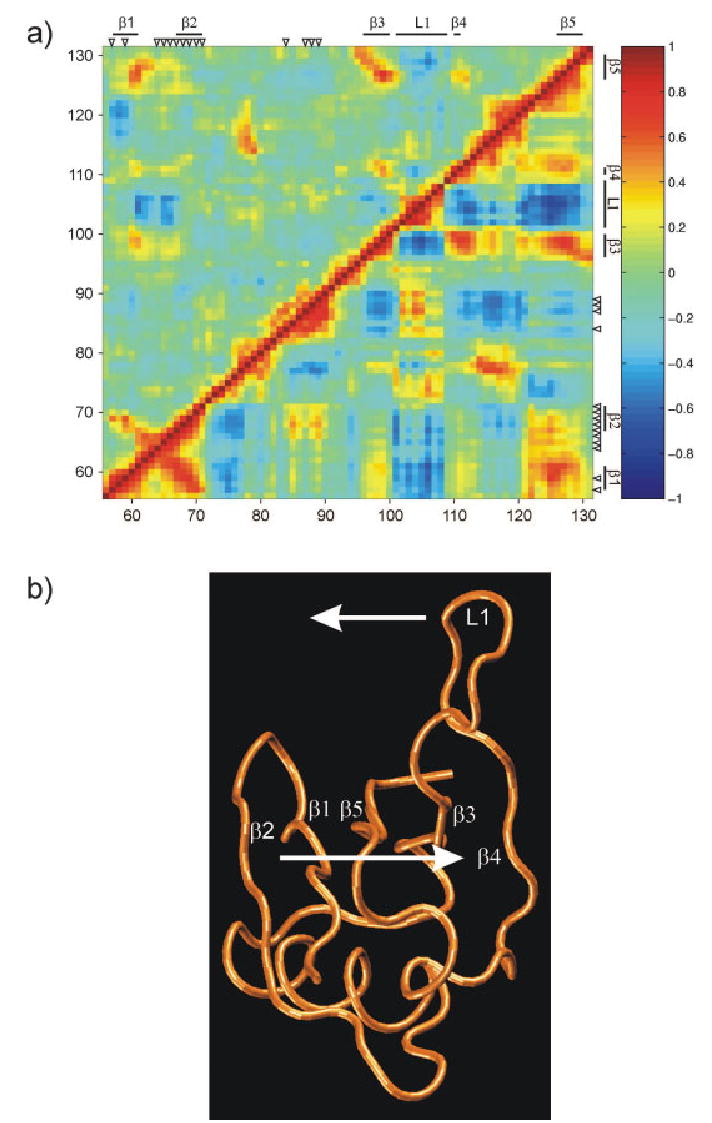
Crosscorrelation map [Eq. (9)] of Cα atomic fluctuations of Raf. (a) The two axes refer to residue indices. Positive correlations are indicated in red, negative in blue. The correlations for the unbound protein are shown in the upper left triangle, the ones for the bound protein in the lower right triangle. Residues in the interface region are marked with ▽, secondary structure elements are indicated by bold lines. Part (b) schematically shows the anticorrelated motion between the β-sheet consisting of β1–β5 and the loop L1 region that occurs in the bound state of Raf.
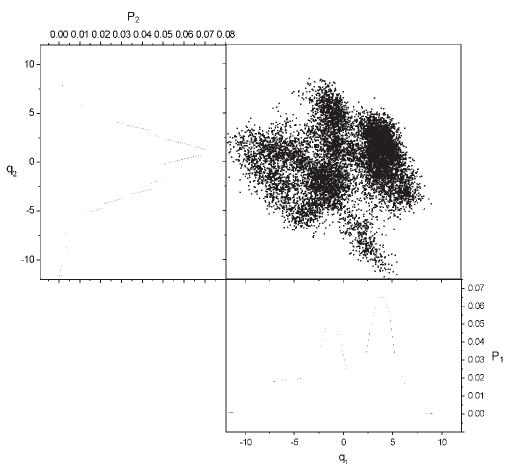
Projection qm of 104 snapshots onto the two-dimensional subspace spanned by the first (m = 1) and second (m = 2) effective modes (a). Probability distribution functions Pm(qm) for the first (b) and second (c) effective mode, respectively, where Pm(qm)dqm represents the probability that the projection is at position qm.
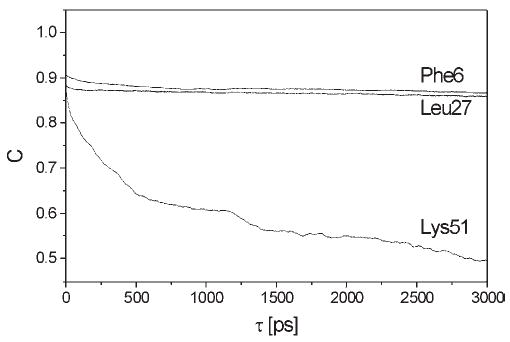
Normalized time– correlation functions for three N—H vectors of unbound Raf after removing overall rotation. Phe6 is located in β-strand 1 of the protein, Leu 27 in the α-helical region, and Lys51 in loop L1.
References
-
- Weiner P, Kollman P. J Comput Chem. 1981;2:287.
-
- Pearlman D, Case D, Caldwell J, Ross W, Cheatham T, III, DeBolt S, Ferguson D, Seibel G, Kollman P. Comp Phys Commun. 1995;91:1.
-
- Allen, M.; Tildesley, D. Computer Simulation of Liquids; Clarendon Press: Oxford, 1987.
-
- Frenkel, D.; Smit, B. Understanding Molecular Simulation: From Algorithms to Applications; Academic Press: San Diego, 1996.
-
- Becker, O.; MacKerell, A.; Roux, B.; Watanabe, M. Computational Biochemistry and Biophysics; Marcel Dekker: New York, 2001.
Publication types
MeSH terms
Substances
Grants and funding
LinkOut - more resources
Full Text Sources
Other Literature Sources
