. 2006;16(1):20-34.
doi: 10.1002/hipo.20129.

Changes in the expression of plasma membrane calcium extrusion systems during the maturation of hippocampal neurons

Affiliations

Changes in the expression of plasma membrane calcium extrusion systems during the maturation of hippocampal neurons

Sertac N Kip et al. Hippocampus. 2006.

Abstract

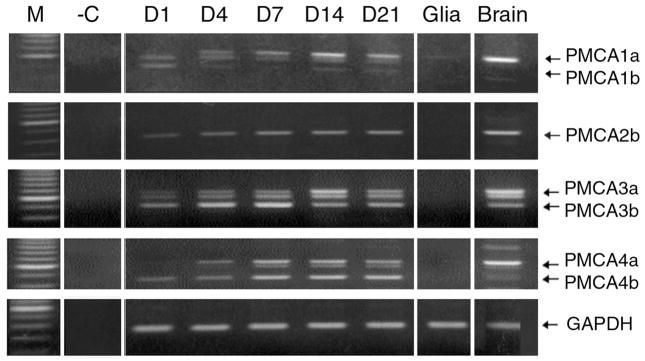
Spatial and temporal control of intracellular calcium signaling is essential for neuronal development and function. The termination of local Ca2+ signaling and the maintenance of basal Ca2+ levels require specific extrusion systems in the plasma membrane. In rat hippocampal neurons (HNs) developing in vitro, transcripts for all isoforms of the plasma membrane Ca2+ pump and the Na/Ca2+ exchanger, and the major nonphotoreceptor Na+/Ca2+,K+ exchangers (NCKX) were strongly upregulated during the second week in culture. Upregulation of plasma membrane calcium ATPases (PMCAs)1, 3, and 4 mRNA coincided with a splice shift from the ubiquitous b-type to the neuron-specific a-type with altered calmodulin regulation. Expression of all PMCA isoforms increased over 5-fold during the first 2 weeks. PMCA immunoreactivity was initially concentrated in the soma and growth cones of developing HNs. As the cells matured, PMCAs concentrated in the dendritic membrane and often colocalized with actin-rich dendritic spines in mature neurons. In the developing rat hippocampal CA1 region, immunohistochemistry confirmed the upregulation of all PMCAs and showed that by the end of the second postnatal week, PMCAs1, 2, and 3 were concentrated in the neuropil, with less intense staining of cell bodies in the pyramidal layer. PMCA4 staining was restricted to a few cells showing intense labeling of the cell periphery and neurites. These results establish that all major Ca2+ extrusion systems are strongly upregulated in HNs during the first 2 weeks of postnatal development. The overall increase in Ca2+ extrusion systems is accompanied by changes in the expression and cellular localization of different isoforms of the Ca2+ pumps and exchangers. The accumulation of PMCAs in dendrites and dendritic spines coincides with the functional maturation in these neurons, suggesting the importance of the proper spatial organization of Ca2+ extrusion systems for synaptic function and development.


Figures

Figure 1
Figure 1
A majority of cells in mature dissociated hippocampal cultures are neurons. 21 DIV cultures were stained with DAPI to visualize all nuclei and with an antibody to NeuN to identify neuronal cells. Most of the nuclei are also NeuN-positive, indicating that these cultures contain only moderate amounts of non-neuronal cells. Scale bar, 10 μm.
Figure 2
Figure 2
Expression of PMCA transcripts during maturation of hippocampal neurons in vitro. RNA was collected from hippocampal neurons cultured for 1, 4, 7, 14, and 21 days as indicated on top of the lanes, as well as from a confluent glia-enriched culture and total rat brain as positive control. RT-PCR was performed using PMCA isoform-specific primers (see Table 1) flanking the alternative splice site C as described in Materials and Methods. The products were run on 2% agarose gels stained with ethidium bromide. M, 100 bp ladder marker lane; -C, negative control lane omitting template DNA. The positions of the major splice forms “a” and “b” of each PMCA isoform are indicated on the right. The intermediate bands between the “a” and “b” splice forms seen mainly with PMCA3 and PMCA4 are due to a/b heteroduplex formation (Zacharias et al., 1994). GAPDH internal loading controls are shown in the bottom panel.
Figure 3
Figure 3
Expression of NC(K)X transcripts during maturation of hippocampal neurons in vitro. A: RT-PCR with NCX-specific primers (Table 1) using RNA from hippocampal neurons cultured for 1, 4, 7, 14, and 21 days, as well as from a confluent glia-enriched culture and total rat brain as positive control. B: RT-PCR with NCKX-specific primers (Table 1) using RNA from hippocampal neurons cultured for 1, 4, 7, 14, and 21 days, as well as from a confluent glia-enriched culture and total rat brain as positive control. The products were run on 2% agarose gels stained with ethidium bromide. M, 100 bp ladder marker lane; -C, negative control lane omitting template DNA. The position of the expected band for each NC(K)X isoform is indicated on the right. Note the presence of multiple alternative splice forms for NCX1 and NCKX2. GAPDH internal loading controls are shown in the bottom panel.
Figure 4
Figure 4
Real-time PCR quantification of the changes in PMCA transcript levels during development of hippocampal neurons in vitro. Real-time PCR was performed on a Light Cycler using PMCA isoform-specific primers (Table 2) and cDNA templates prepared from hippocampal neurons harvested after 1, 7, 14, and 21 days in vitro (DIV). Primers for 18S RNA were used as internal standard and control. Quantification of PMCA transcript levels relative to 18S RNA transcripts was performed as described in Materials and Methods, and the data are displayed as the mean +/− S.E. of the ratios of specific PMCA transcripts to 18S RNA transcripts. Results are pooled from two separate experiments and from 3 samples for 7, 14, and 21 DIV cultures and from 2 samples for 1 DIV cultures.
Figure 5
Figure 5
Expression of PMCA isoform proteins during maturation of hippocampal neurons in vitro. Total cell lysates were prepared from hippocampal neurons cultured for 4, 7, 14, and 21 days, as well as from total rat brain and 21-day glial cultures as indicated on top of each lane. Equal amounts of protein were run on 4–12% Nu-Page gradient gels and processed for Western blotting as described in Materials and Methods. The pan-PMCA antibody 5F10 was used to detect all PMCAs (top panel), and antibodies NR-1, NR-2, NR-3, and JA9 were used to detect PMCA isoforms 1, 2, 3, and 4 as indicated on the right of each panel. Anti-actin antibody was used to probe for β-actin as an internal control for protein loading (bottom panel).
Figure 6
Figure 6
Immunofluorescence localization of PMCAs in developing hippocampal neurons. Hippocampal neurons were cultured for 4 (A and B), 11 (C and D), or 18 days (E and F), and were then fixed, permeabilized and stained with an antibody (5F10) against all PMCAs and with rhodamine-phalloidin. Secondary antibodies were used to visualize PMCA (green). Panels A, C, and E show PMCA staining only (green channel) whereas panels B, D, and F show dual staining for PMCA and actin. Note the diffuse and largely intracellular localization of the PMCA in cell bodies and early neurites, including dendritic growth cones (arrows in A and B) of immature neurons, the increase in peripheral and clustered PMCA staining in the membrane of developing neurites, and young dendritic spines (arrows in C and D) at day 11, and the appearance of numerous PMCA-positive clusters on dendritic spines co-localizing with actin (yellow puncta, arrows in inset, E and F) in the dendrites of mature neurons. Scale bar = 10 μm.
Figure 7
Figure 7
Low-magnification views of isoform-specific PMCA staining in the rat hippocampal formation. At postnatal day 1 (PND1), modest staining for PMCA1 and PMCA2 contrasted with very weak staining for PMCA3. PMCA4 stained the granule cell layer of dentate gyrus, but staining was very weak in Ammon’s horn. At PND30, staining was increased for each isoform. Scale bars: 500 μm
Figure 8
Figure 8
Micrographs showing laminar distribution of isoform-specific PMCA immunostaining in the developing rat hippocampal subfield CA1. Punctuate staining for PMCA1 and 2 was already noticeable by PND1, whereas punctuate staining for PMCA3 was barely detectable until PND 14. PMCA4 stained scattered interneurons late in development. SR, stratum radiatum; PCL, pyramidal cell layer; SO, stratum oriens. Scale bar: 50 μm.

References

    1. Araque A, Parpura V, Sanzgiri RP, Haydon PG. Tripartite synapses: glia, the unacknowledged partner. Trends Neurosci. 1999;22:208–215. - PubMed
    1. Augustine GJ, Santamaria F, Tanaka K. Local calcium signaling in neurons. Neuron. 2003;40:331–346. - PubMed
    1. Ausubel FM, Brent R, Kingston RE, Moore DD, Seidman JG, Smith JA, Struhl K. Current Protocols in Molecular Biology. New York, NY: John Wiley and Sons; 1998.
    1. Berridge MJ, Bootman MD, Roderick HL. Calcium signalling: dynamics, homeostasis and remodelling. Nature Rev Mol Cell Biol. 2003;4:517–529. - PubMed
    1. Blaustein MP, Lederer WJ. Sodium/calcium exchange: Its physiological implications. Physiol Rev. 1999;79:763–854. - PubMed

Publication types

MeSH terms