. 2005 Oct 4:6:139.
doi: 10.1186/1471-2164-6-139.

In silico characterization of the family of PARP-like poly(ADP-ribosyl)transferases (pARTs)

Affiliations

In silico characterization of the family of PARP-like poly(ADP-ribosyl)transferases (pARTs)

Helge Otto et al. BMC Genomics. .

Abstract

Background: ADP-ribosylation is an enzyme-catalyzed posttranslational protein modification in which mono(ADP-ribosyl)transferases (mARTs) and poly(ADP-ribosyl)transferases (pARTs) transfer the ADP-ribose moiety from NAD onto specific amino acid side chains and/or ADP-ribose units on target proteins.

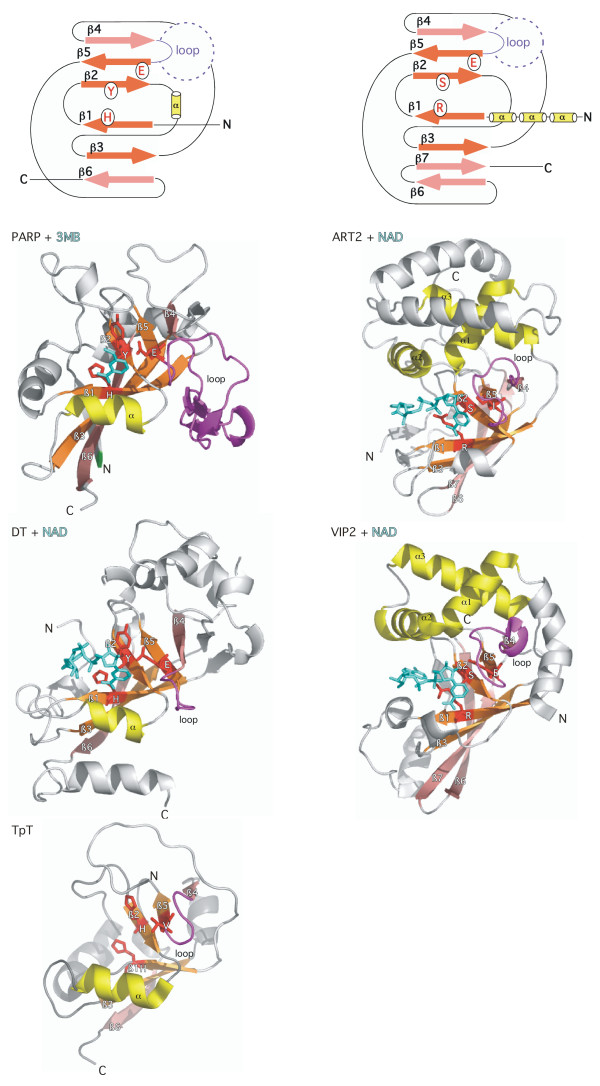
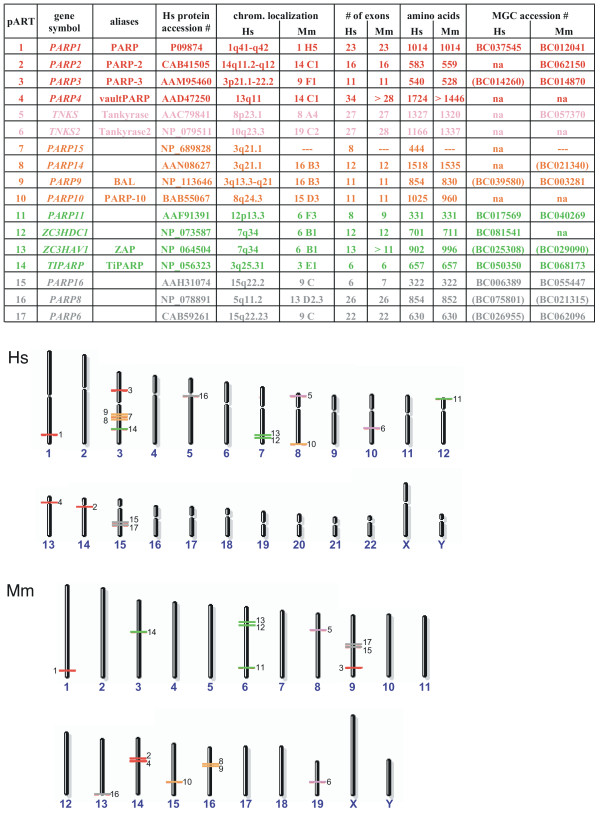
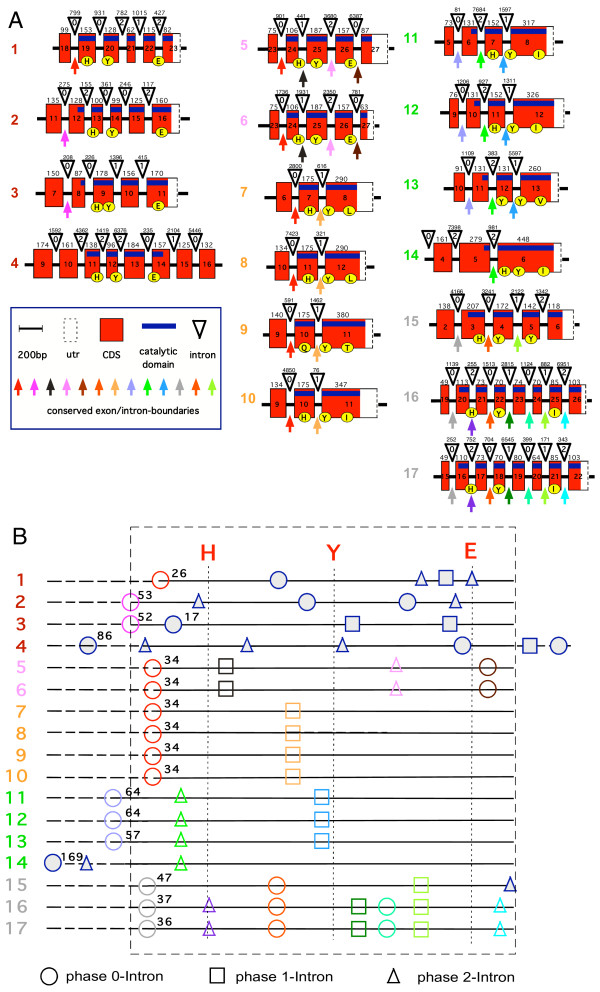
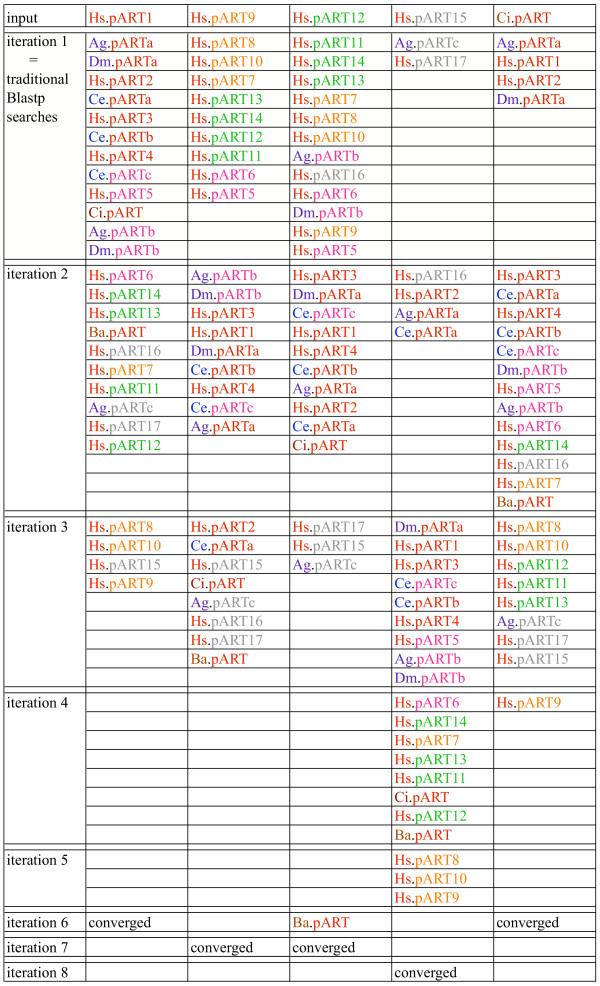
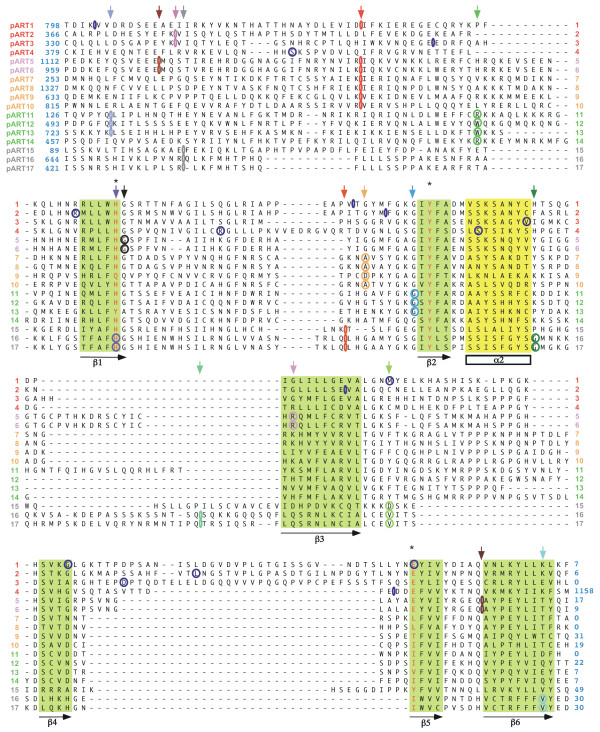
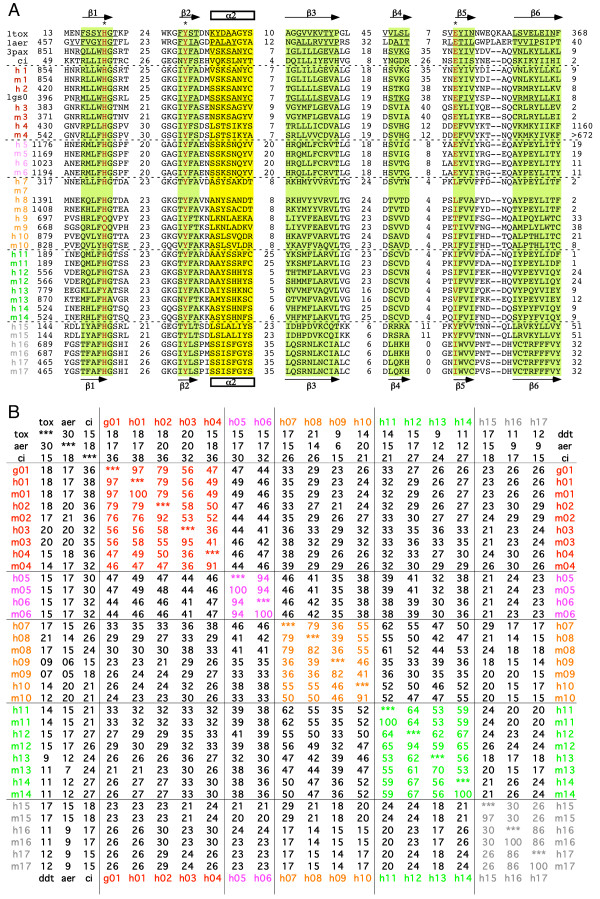
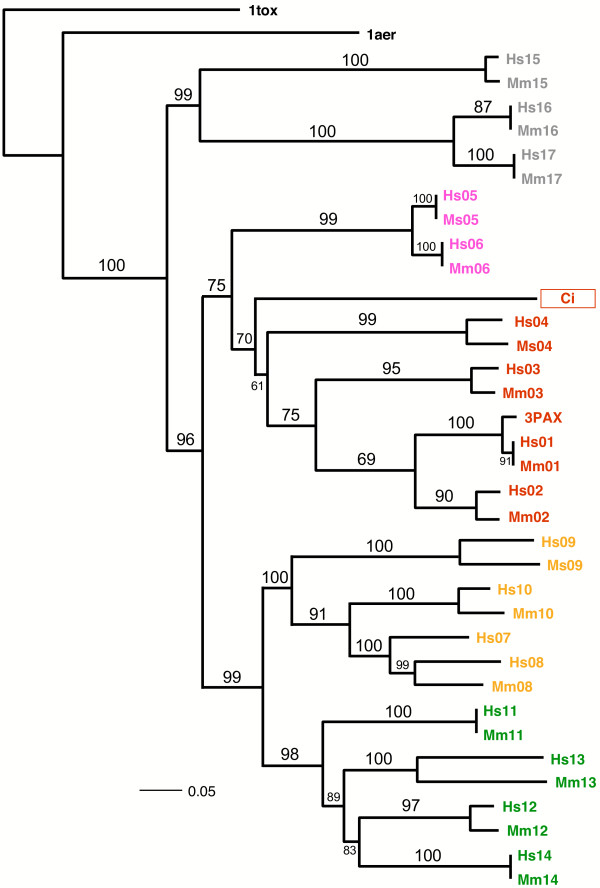
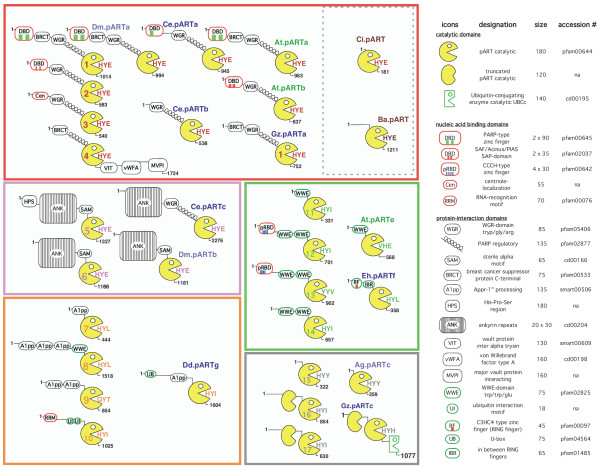
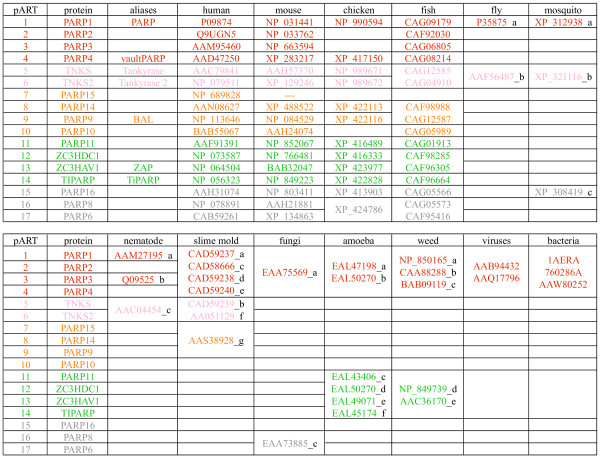
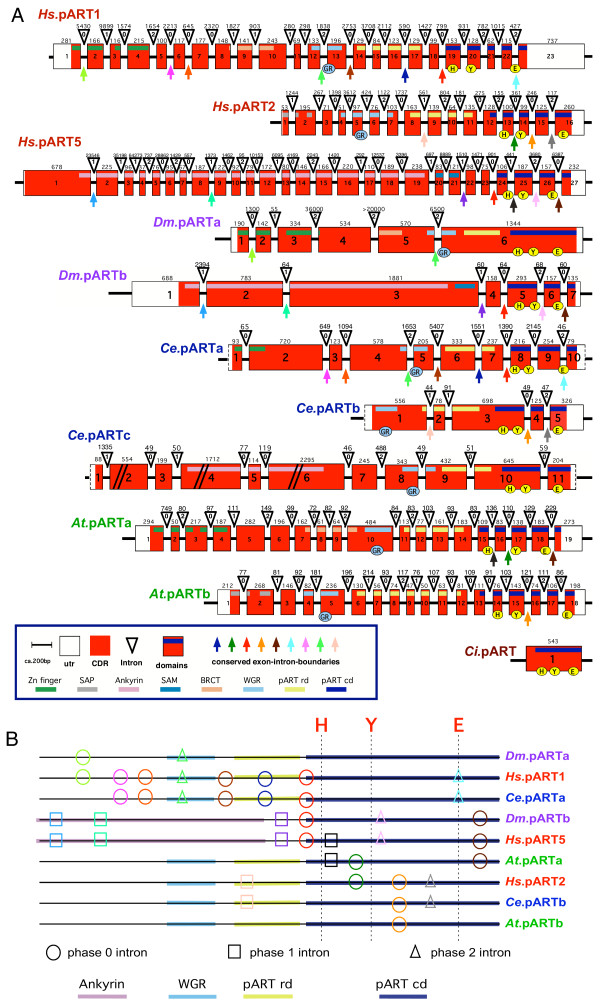
Results: Using a combination of database search tools we identified the genes encoding recognizable pART domains in the public genome databases. In humans, the pART family encompasses 17 members. For 16 of these genes, an orthologue exists also in the mouse, rat, and pufferfish. Based on the degree of amino acid sequence similarity in the catalytic domain, conserved intron positions, and fused protein domains, pARTs can be divided into five major subgroups. All six members of groups 1 and 2 contain the H-Y-E trias of amino acid residues found also in the active sites of Diphtheria toxin and Pseudomonas exotoxin A, while the eleven members of groups 3 - 5 carry variations of this motif. The pART catalytic domain is found associated in Lego-like fashion with a variety of domains, including nucleic acid-binding, protein-protein interaction, and ubiquitylation domains. Some of these domain associations appear to be very ancient since they are observed also in insects, fungi, amoebae, and plants. The recently completed genome of the pufferfish T. nigroviridis contains recognizable orthologues for all pARTs except for pART7. The nearly completed albeit still fragmentary chicken genome contains recognizable orthologues for twelve pARTs. Simpler eucaryotes generally contain fewer pARTs: two in the fly D. melanogaster, three each in the mosquito A. gambiae, the nematode C. elegans, and the ascomycete microfungus G. zeae, six in the amoeba E. histolytica, nine in the slime mold D. discoideum, and ten in the cress plant A. thaliana. GenBank contains two pART homologues from the large double stranded DNA viruses Chilo iridescent virus and Bacteriophage Aeh1 and only a single entry (from V. cholerae) showing recognizable homology to the pART-like catalytic domains of Diphtheria toxin and Pseudomonas exotoxin A.

Conclusion: The pART family, which encompasses 17 members in the human and 16 members in the mouse, can be divided into five subgroups on the basis of sequence similarity, phylogeny, conserved intron positions, and patterns of genetically fused protein domains.


Figures

Figure 1
Figure 1
Schematic illustration of the distinguishing structural features of the PARP-1/DT vs. the ART2/VIP2 subfamilies of ADP-ribosyltransferases. Two abutting sheets of anti-parallel β strands form the upper and lower jaws of a Pacman-like NAD-binding crevice in all known structures of ADP-ribosyltransferases. The distinguishing structural features of the PARP/DT and ART2/VIP2 subfamilies are depicted schematically on top and are highlighted in the structures of chicken PARP-1 (3pax), diphtheria toxin (DT) (1tox), an archael tRNA:NAD 2'-phosphotransferase (TpT) (1wfx), rat ART2 (1og3) and B. cereus VIP2 toxin (1qs2) below. The structures are depicted from the "front view" with a full view of the ligands bound in the active site crevice. The ligands NAD and 3MB are colored cyan and are depicted as stick models. The central four β-strands (from top to bottom: β 5, β 2, β 1, β 3, colored orange) are conserved in all mARTs and pARTs. The β strands at the edges of the respective sheets (β 4 and β 6, colored pink) show greater structural variation than the central β strands. The H-Y-E motif residues are depicted in red and their side chains are shown as sticks. The glutamic acid residue at the front edge of β 5 is the critical catalytic residue in both diphtheria toxin and PARP-1 – a corresponding glutamic acid residue is observed also in the 3D structures of rat ART2 and numerous bacterial mARTs. Diphtheria toxin (1tox), pseudomonas exotoxin A (1aer), PARP-1 (3pax), and PARP-2 (1gs0) share the following structural features which are not conserved in either rat ART2 (1og3) or most other bacterial mARTs: the orientation of β 6, the alpha helix between β 2 and β 3 (colored yellow) and the conserved histidine and tyrosine amino acid residues in β 1 and β 3. The loop between β 4 and β 5 (colored magenta) is thought to play a role in the recognition of target proteins and ADP-ribose polymers. Distinguishing features of ART2, VIP2, iota toxin (1gir), and the C3 exoenzymes (1g24, 1ojz) include three conserved alpha helices upstream of β strand 1, a seventh β strand that displaces β strand 6 and an R-S-E- motif instead of the H-Y-E motif of PARP-1 and DT. (Note that the depicted ART2 structure carries a site directed mutation of the catalytic glutamic acid residue E189I). The recently determined 3D structure of the tRNA:NAD 2'-phosphotransferase (1wfx) bears striking resemblance to that of DT and PARP-1 and carries an H-H-V variant of the H-Y-E motif. Note that the structure of the diphtheria toxin catalytic domain shown here in complex with NAD is truncated C-terminally at the proteolytic cleavage site that separates this domain from the translocation domain. The PARP-1 catalytic domain shown here is truncated N-terminally at the position of the phase 0 intron that separates this domain from a neighboring helical domain. The TpT catalytic domain is truncated N-terminally at the point of fusion to a winged-helix domain.
Figure 2
Figure 2
Chromosomal localizations and exon compositions of the human and mouse pART family members. A) pART family members are sorted by subgroup on the basis of similarities in amino acid sequence, intron positions and associated protein domains. Color-coding of subgroups is as follows: 1 = red, 2 = pink, 3 = orange, 4 = green, 5 = grey. This color-coding is used in subsequent figures. Official gene designations, common aliases and accession numbers are shown. Exon compositions and lengths of open reading frames are given for the longest known or predicted gene transcripts. Available full length cDNAs from the Mammalian Gene Collection (MGC) are indicated with their respective accession numbers. MGC cDNAs which apparently do not contain the full open reading frame are indicated in parentheses. Hs = Homo sapiens, Mm = Mus musculus. B) Chromosomal localizations of pART genes were determined by tBLASTn searches of the respective genome sequences using the amino acid sequences of the catalytic domains of individual pARTs. Members of the five pART family subgroups are color-coded as in A).
Figure 3
Figure 3
Schematic diagram of the exon/intron structures of the regions encoding the catalytic domain of pART family members. A) Exon/intron structures were determined by BLASTn searches of the human genome sequence with individual pART cDNA sequences. Only the exons corresponding to the catalytic domain of PARP-1 are shown. The coding region is marked in red, the 3' untranslated region (utr) is marked in white, and a blue bar marks the region corresponding to the catalytic domain. Exons are represented as boxes with the width of each box reflecting the size of the respective exon (the 3' utr is not drawn to scale). Exon numbers are given with exon 1 corresponding to the exon encoding the presumptive initiation methionine. In all cases except pART4 (VPARP) the catalytic domain is encoded by the 3' terminal exons. Exon sizes (or size of coding region in case of the 3' exons) in basepairs are indicated on top of the boxes. Introns are depicted as triangles and are not drawn to scale. Intron sizes in base pairs are indicated on top of the triangles. The position of each intron with respect to the reading frame is indicated in the triangles (0 = between codons, +1 = between codon positions 1 and 2, +2 = between codon positions 2 and 3). Conserved exon boundaries are marked by colored arrows. Codons corresponding to the H-Y-E motif in the NAD binding crevice of DT and PARP-1 (see Fig. 1) are marked by yellow circles. B) The catalytic domain as delineated in this paper is indicated by the dashed rectangle. For each pART the cDNA coding region within the catalytic domain is marked by a straight line, regions extending beyond this domain in the 5' direction (and in the 3' driection in case of pART4) are marked by dashed lines. The positions of the codons corresponding to the H, Y, E residues in the NAD-binding crevice are indicated by vertical lines. Intron phases are indicated by circles (phase 0), boxes (phase 1), and triangles (phase 2). Numbers indicate the distance in codons between the conserved histidine in β 1 and the next upstream phase 0 intron. Color-coding of conserved introns corresponds to that shown in A). Nonconserved introns are indicated in blue (filled) icons.
Figure 4
Figure 4
Representative tiling paths of PSI-BLAST searches initiated with the catalytic domain amino acid sequences of selected pART family members. PSI-BLAST searches were initiated with the catalytic domain amino acid sequences of the pARTs indicated on top as query sequences with the default threshold setting for the expect value of 0.005. Matching sequences from selected model organisms are indicated at the iteration in which they first appeared above threshold. pART subgroups are color coded as in Figure 2. Accession numbers of the indicated pARTs are listed in Figures 2 and 9. Species of origin is color-coded in the two letter abbreviation of the organism as follows: Homo sapiens (Hs) red, Drosophila melanogaster (Dm) and Anopheles gambiae (Ag) purple, Caenorrhabditis elegans (Ce) blue, Chilo iridescent virus (Ci) and Bacteriophage Aeh (Ba) brown.
Figure 5
Figure 5
Multiple amino acid sequence alignment of the catalytic cores of the human pART family. The multiple sequence alignment was generated with T-Coffee and manually adjusted using the results of the PSI-BLAST, PSIPRED, and GenTHREADER analyses. Numbers at the sequence ends indicate the number of additional residues upstream and downstream of the alignment shown. Residues corresponding to the H Y E motif in the NAD binding crevice of diphtheria toxin are in red and marked by asterisks. The conserved β sheets and alpha helix are shaded in green and yellow. Conserved intron positions are marked in the multiple alignment using the same color-coding as in Figure 3. Conserved intron positions are indicated also above the alignment with arrows. Non-conserved intron positions are marked in blue in the alignment.
Figure 6
Figure 6
Structure based amino acid sequence alignment of the catalytic cores of the pART gene family. A) The alignment is restricted to those regions corresponding to the conserved secondary structure units of PARP-1 and DT as highlighted in Figure 1. The H Y E motif is marked by asterisks and is highlighted in red. Black numbers indicate amino acid residues from the N- and C-terminal ends of the protein and within the loops connecting the structure units shown. For proteins with known 3D structures the pdb accession number is given and the residues corresponding to respective secondary structure units are underlined. 1tox = diphtheria toxin; 1aer = pseudomonas exotoxin A, 3pax = chicken PARP-1 (pART1), 1gs0 = mouse PARP-2 (pART2). Human and mouse pARTs are indicated by colored numbers. The sequence of the putative pART from Chilo iridescent virus is also shown for comparison (ci). B) Pairwise percentage sequence identities were calculated for the 66 amino acid residues shown in A), which correspond to the conserved core secondary structure units in Figure 1.
Figure 7
Figure 7
Phylogram of the evolutionary relationship of the pART family. Evolutionary relationships of the amino acid sequences in the catalytic core of the pARTs shown in Figure 6 are illustrated as a maximum a posteriori phylogram (MAP) of Bayesian Markov Chain Monte Carlo analysis (pP = 0.92). Posterior probabilities were converted into percentages and are shown above the branches. Members of the five pART family subgroups are color-coded as in Figure 2: subgroup 1 = red, 2 = pink, 3 = orange, 4 = green, 5 = grey. Hs = Homo sapiens, Mm = Mus musculus.
Figure 8
Figure 8
Schematic diagram of the domain structures of human pARTs and pARTs from distantly related organisms. Recognizable protein domains in the pART family are represented by the icons defined on the right. The domain structures of human pARTs (on the left, numbered Pacman icons) and related pARTs from other species are illustrated schematically. Potential DNA binding domains are boxed in red, potential ubiquitylation motifs are boxed in green. Members of the five pART family subgroups are grouped within colored boxes using the color-coding as in Figure 2: subgroup 1 = red, 2 = pink, 3 = orange, 4 = green, 5 = grey. Amino acids corresponding to the HYE catalytic site motif of DT and PARP-1 are shown in the mouths of the Pacman icons. Black numbers indicate protein lengths in number of amino acids. Species of origin is color-coded in the two letter abbreviation of the organisms as in Figures 4 and 9: Drosophila melanogaster (Dm) and Anopheles gambiae (Ag) purple, Caenorrhabditis elegans (Ce), Dictyostelium discoideum (Dd), Entamaoeba histolytica (Eh), and Gibberella zeae (Gz) blue, Arabidopsis thaliana (At) green, Chilo iridescent virus (Ci) and Bacteriophage Aeh (Ba) brown. Protein database accession numbers for the illustrated pARTs are listed in Figures 4 and 9. On the right, the approximate size of each domain is indicated in number of amino acid residues. The accession numbers of the respective domain families in the pfam, cd, and smart databases are indicated. In case of zinc finger (zf) containing domains, the number of recognizable zinc fingers is indicated by colored bars within the icon.
Figure 9
Figure 9
pARTs in distantly related species. pART relatives were identified by PSI-BLAST searches as in Figure 4. Matching sequences from other organisms were sorted by group on the basis of sequence similarity and associated domains. Accession numbers are given for pARTs from Homo sapiens (human), Mus musculus (mouse), Gallus gallus (chicken), Tetraodon nigroviridis (puffer fish), Drosophila melanogaster (fruit fly), Anopheles gambiae (malaria mosquito), Caenorhabditis elegans (nematode), Dictyostelium discoideum (slime mold), Gibberella zeae (ear root microfungus), Entamaoeba histolytica (amoeba), Arabidopsis thaliana (cress plant), Chilo iridescent virus and Bacteriophage Aeh1 (viruses), Pseudomonas aeruginosa, Corynebacterium diphtheriae and Vibrio cholerae (bacteria). Lower case letters in black indicate the pART designations used in Figure 8.
Figure 10
Figure 10
Schematic diagram of the exon/intron structures of pART family members of distantly related organisms. A) Exon/intron structures were determined by BLASTn searches of the genome browsers using the pART cDNA sequences. The positions of codons corresponding to the H Y E motif in the NAD-binding crevice of diphtheria toxin are marked by yellow circles. The position of the conserved glycine and arginine pair of residues within the WGR domain is marked in blue. Coding regions for catalytic and other domains are indicated by colored bars. Conserved introns are marked by colored arrows. B) The diagram contains only those introns that are conserved in at least two distantly related species. Color-coding of the introns corresponds to that shown in A). The position of codons encoding/corresponding to the H, Y, E residues in the NAD binding crevice are indicated by vertical lines. The position of each intron with respect to the codon is indicated by circles (phase 0 introns), boxes (phase 1 introns), and triangles (phase 2 introns). Coding regions for catalytic and other selected domains are indicated by colored lines as in A).

References

    1. Aktories K, Just I. Bacterial Protein Toxins. Berlin, Springer Verlag; 2000.
    1. Althaus FR, Hilz H, Shall S. ADP-ribosylation of proteins. Berlin, Springer Verlag; 1985.
    1. Haag F, Koch-Nolte F. ADP-Ribosylation in Animal Tissues: Structure, Function and Biology of Mono(ADP-Ribosyl)transferases and Related Enzymes. Vol. 419. New York, Plenum Press; 1997. - PubMed
    1. Jacobson MK, Jacobson EL. ADP-ribose Transfer Reactions: Mechanisms and Biological Significance. New York, Springer Verlag; 1989.
    1. Honjo T, Nishizuka Y, Hayaishi O. Diphtheria toxin-dependent adenosine diphosphate ribosylation of aminoacyl transferase II and inhibition of protein synthesis. J Biol Chem. 1968;243:3553–3555. - PubMed

Publication types

MeSH terms

LinkOut - more resources