Review
. 2005 Oct 15;86(3):297-305.
doi: 10.1016/j.physbeh.2005.08.003. Epub 2005 Oct 3.

The analysis of interaural time differences in the chick brain stem

Affiliations
Review

The analysis of interaural time differences in the chick brain stem

Richard L Hyson. Physiol Behav. .

Abstract

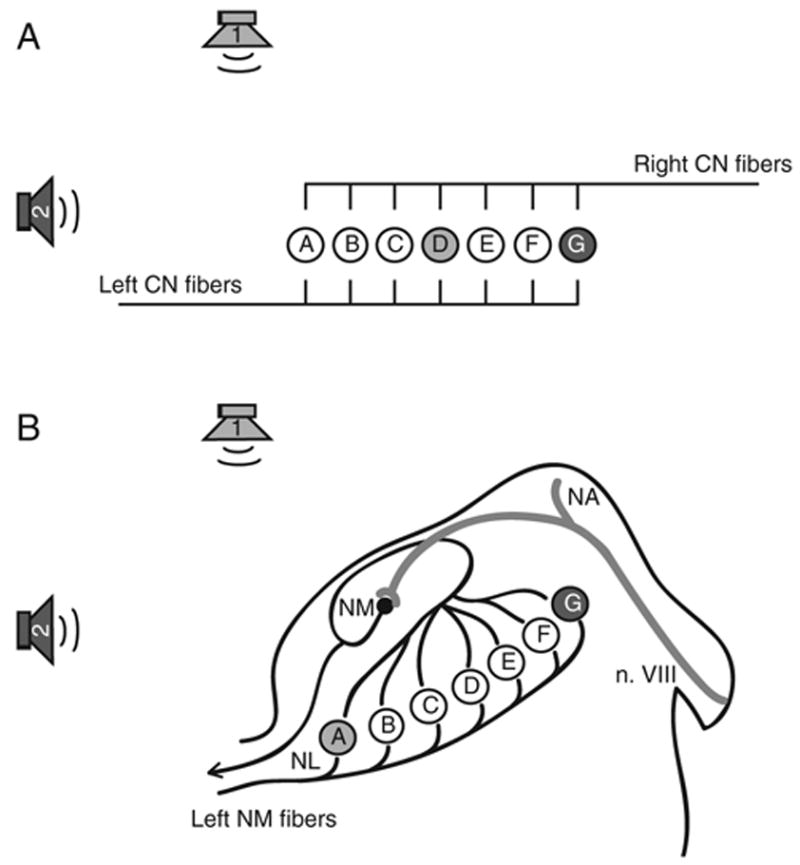
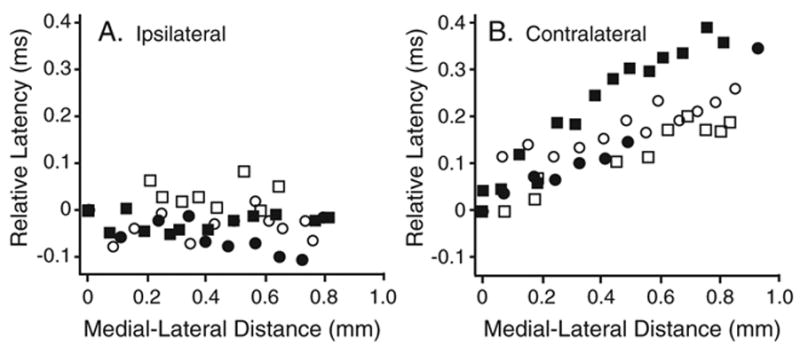
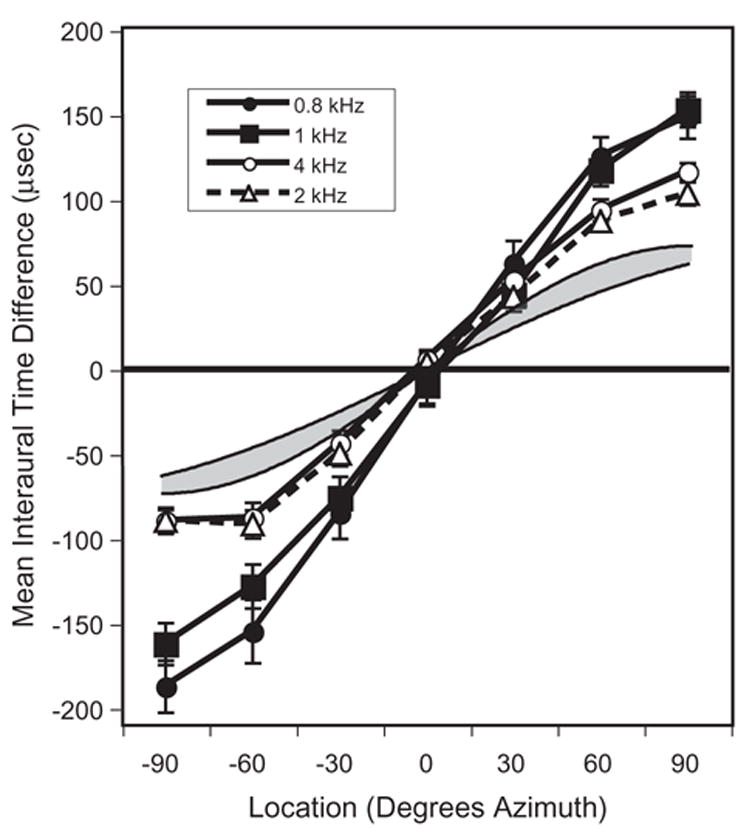
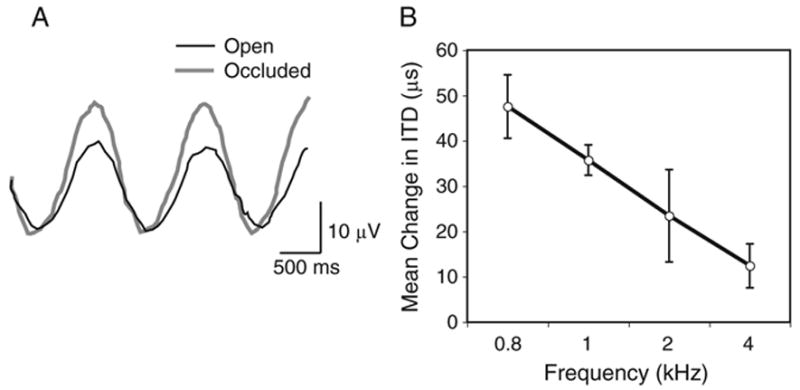
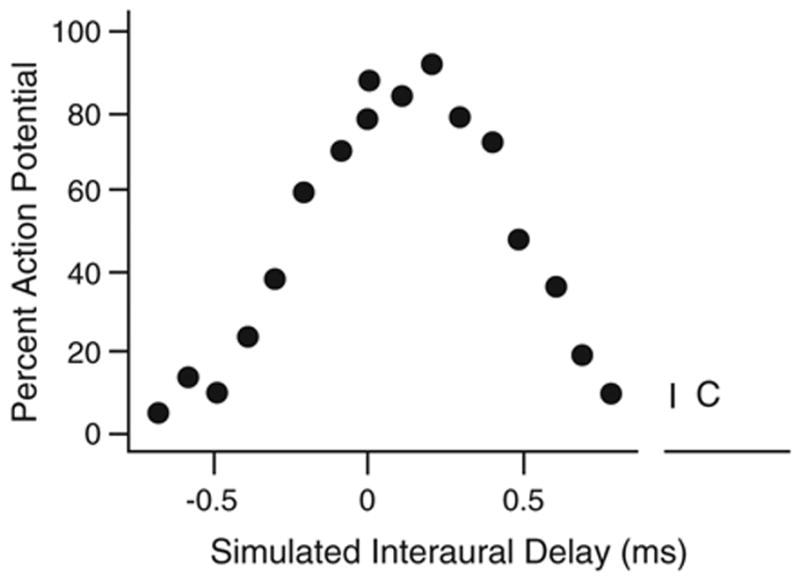
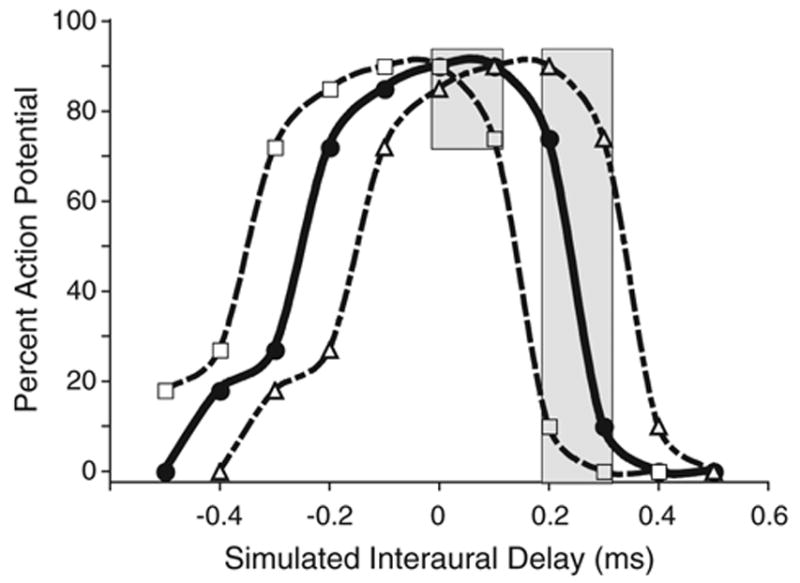
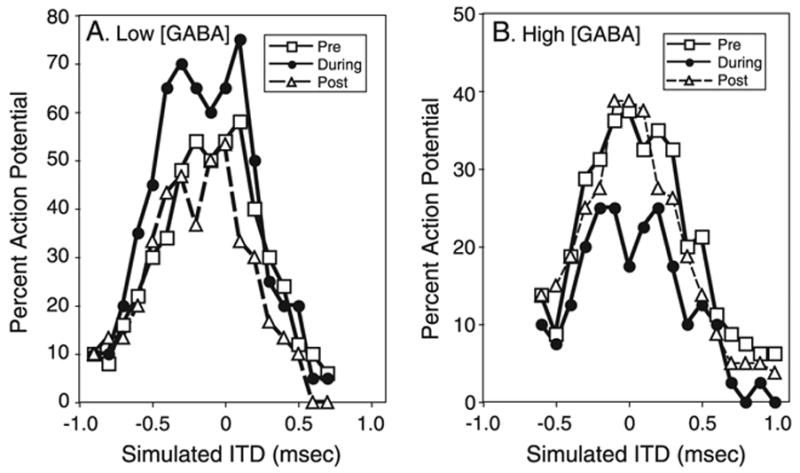
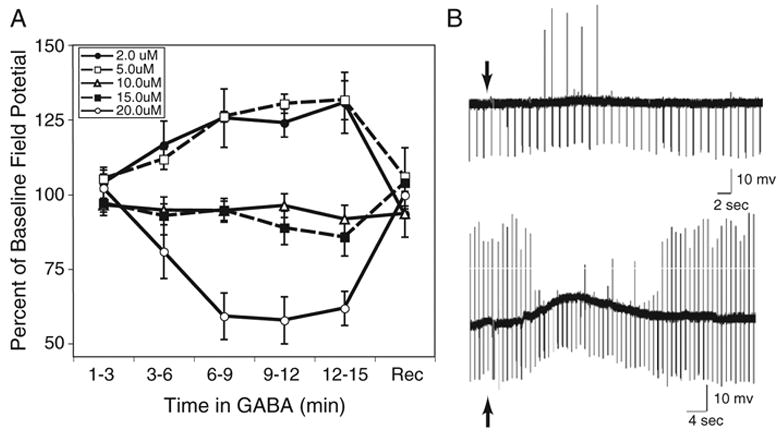
The brain stem auditory system of the chick has proven to be a useful model system for analyzing how the brain encodes temporal information. This paper reviews some of the work on a circuit in the brain stem that compares the timing of information coming from the two ears to determine the location of a sound source. The contralateral projection from the cochlear nucleus, nucleus magnocellularis (NM), to nucleus laminaris (NL) forms a delay line as it proceeds from medial to lateral across NL. NL neurons function like coincidence detectors in that they respond maximally when input from the two ears arrive simultaneously. This arrangement may allow NL to code sound space by the relative level of activity across the nucleus. The head anatomy of the chick allows for enhancement of the functional interaural time differences. Comparing the functional interaural time differences to the length of the neural delay line suggests that each NL can encode approximately one hemifield of sound space. Finally it is suggested that inhibitory input into the NM-NL circuit may provide a means to dynamically adjust the gain of the circuit to allow accurate coding of sound location despite changes in overall sound intensity.


Figures

Fig. 1
Fig. 1
Models of how the brain might process interaural time differences. A. A version of the classic Jeffress model [1] with two opposing delay lines converging on an array of postsynaptic coincidence detectors. When the sound source is at midline (Speaker 1), information from the left and right cochlear nucleus (CN) fibers will reach Cell D simultaneously, whereas when the sound source is off to the left side (Speaker 2), action potentials begin in the left CN first and information from the two sides will arrive at Cell G simultaneously. Consequently, sound location is translated to a neural location of coincidence along the array of neurons. B. The circuit for coding interaural time differences in the chick brain stem. Auditory nerve fibers (n. VIII) enter the brain stem and bifurcate, sending one branch to nucleus angularis (NA) and another branch to nucleus magnocellularis (NM). NM fibers project bilaterally to nucleus laminaris (NL). In contrast to the Jeffress model, it appears that delay lines exist only in the contralateral projection to NL. The ipsilateral projection from NM to NL appears to splay out along the line of NL neurons such that axonal lengths to all areas are approximately equal. The contralateral projection, however, has a systematic increase in axonal length as the fiber proceeds from medial to lateral across NL. Estimates of the transmission delays suggest that when sounds are located near midline (Speaker 1), medial cells (Cell A) will receive input from the two NM at the same time, whereas when the sound is off to the contralateral side (Speaker 2), laterally placed NL neurons will receive coincident input (Cell G).
Fig. 2
Fig. 2
Delay Lines. Physiological measurements from a brain slice preparation of the chick auditory system confirm that delay lines exist only in the contralateral projection to NL. A. The recording electrode was placed at various medial to lateral locations in NL. There is little difference in the latency of action potentials reaching various NL locations when the ipsilateral NM is stimulated. B. In contrast, there is a near linear increase in the latency of responses across the medial to lateral extent of NL when the contralateral NM is stimulated. Different symbols represent the recordings made in different slices. These slices were maintained at 34 °C, giving a total delay across NL of approximately 300 μs. When recorded at physiological temperature (40–41 °C), a delay of approximately 180 μs is observed across the medial to lateral extent of NL (not shown). Data replotted from Ref. [3].
Fig. 3
Fig. 3
Augmentation of Functional ITDs. Interaural time differences between cochlear microphonic responses in the two ears of a chick as location of the sound source was moved in azimuth. The gray area between the curved lines represents the range of theoretically maximal ITDs that would be expected based on the distance between the two ears (models of Kuhn [32] and Woodworth [33]). The measured ITDs were much greater than the predicted ITDs, particularly for low frequency sounds. Data replotted from Ref. [7], bars represent standard error of the mean.
Fig. 4
Fig. 4
Augmentation of ITD is attributable to interaural canal. A. Example of the effects of occluding one ear on the cochlear microphonic (CM) response of the contralateral ear. A sound source was placed at 90° azimuth and CM responses were recorded in the distal ear. When the ear near the sound source was occluded, the CM in the distal ear became larger and occurred earlier. This indicates that sound transmission through the interaural canal enhances functional ITDs. B. The mean change in time of the CM when the contralateral ear was occluded was greatest for low frequency sounds. Data replotted from Ref. [7], bars represent standard error of the mean.
Fig. 5
Fig. 5
Coincidence detection. NL neurons can function as coincidence detectors. The responses of single NL neurons were measured in a brain slice while stimulating both the ipsilateral and contralateral inputs. Interaural time differences were simulated by varying the delay between the stimulation of the two inputs. As can be seen in this example, neurons showed a greater percentage of action potentials when inputs from the two NM arrive at the same time (s-ITD=0). I (ipsilateral) and C (contralateral) represent the percentage of action potentials evoked by unilateral stimulation. Data replotted from Ref. [8].
Fig. 6
Fig. 6
Population code model. Three hypothetical cells along nucleus laminaris with simulated interaural time difference curves based on the responses of cells recorded in a brain slice preparation. The peaks of the curves are placed 100 μs apart. The gray box on the left shows the inclusive variation in response rate that would be observed across a 100 μs change in delay. Very little variation in response rate across this population of cells would be observed if sound location was coded at the peak of these s-ITD curves. In contrast, the same 100 μs change in delay across the point of steepest slope (gray box on the right), would result is a large variation in response rate across the array of cells.
Fig. 7
Fig. 7
s-ITD functions and GABA. s-ITD functions recorded in a brain slice preparation before, during and after bath application of GABA. A. A low concentration of GABA (1.25 μM) increased the excitability of the NL neuron and sharpened the s-ITD function. B. A high concentration of GABA (10 μM) reduced the excitability of the NL neuron. Replotted from Ref. [9].
Fig. 8
Fig. 8
Bidirectional effects of GABA in NM. GABA either increases or decreases excitability of nucleus magnocellularis (NM) neurons. A. Changes in the amplitude of an averaged field potential recorded in NM following electrical stimulation of the auditory nerve at various times following the addition of GABA to the bathing medium. The field potentials are enhanced when a low concentration of GABA is added to the bath, but these potentials are reduced when a higher concentration of GABA is added to the bath. Rec. refers to the recovery of the field potential amplitude after return to the normal bathing solution. Bars represent standard error of the mean. B. Intracellular recordings from NM neurons during a brief application of GABA. Downward deflections are produced by intracellular current injections. Changes in the size of the negative voltage deflections reflect changes in input resistance of the cell. The auditory nerve was repeatedly stimulated, and the large upward deflections are action potentials produced by this afferent drive. When the auditory nerve stimulation was subthreshold, a small concentration of GABA resulted in a slight depolarization and the emergence of auditory nerve-driven action potentials (upper trace). When the auditory nerve stimulation was suprathreshold, application of a larger dose of GABA produced a pronounced depolarization and the inhibition of auditory nerve-driven action potentials (lower trace). GABA was applied by focal pressure injection into the media near the recorded cell at the time indicated by the arrows.

Similar articles

Cited by

References

    1. Jeffress LA. A place theory of sound localization. J Comp Physiol Psychol. 1948;41:35–9. - PubMed
    1. Young SR, Rubel EW. Frequency-specific projections of individual neurons in chick brainstem auditory nuclei. J Neurosci. 1983;3:1373–8. - PMC - PubMed
    1. Overholt EM, Rubel EW, Hyson RL. A circuit for coding interaural time differences in the chick brainstem. J Neurosci. 1992;12:1698–708. - PMC - PubMed
    1. Calford M, Piddington R. Avian interaural canal enhances interaural delay. J Comp Physiol A. 1988;162:503–10.
    1. Hill KG, Lewis DB, Hutchings ME, Coles RB. Directional hearing in the Japanese quail (Coturnix–Coturnix–japonica): I. Acoustic properties of the auditory system. J Exp Biol. 1980;86:135–51.

Publication types

MeSH terms

Substances

LinkOut - more resources