Comparative Study
. 2005 Oct 3;202(7):901-6.
doi: 10.1084/jem.20050784.

Developmental regulation of Foxp3 expression during ontogeny

Affiliations
Comparative Study

Developmental regulation of Foxp3 expression during ontogeny

Jason D Fontenot et al. J Exp Med. .

Abstract

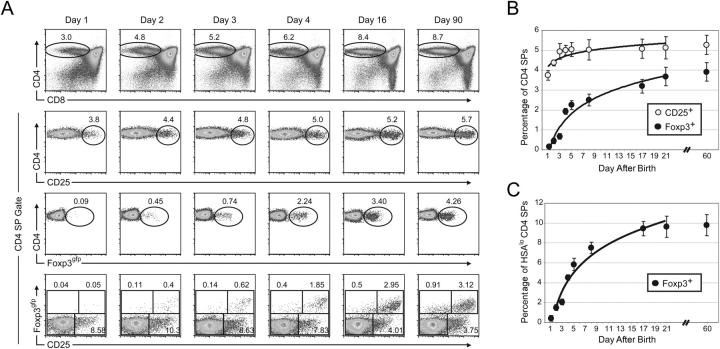
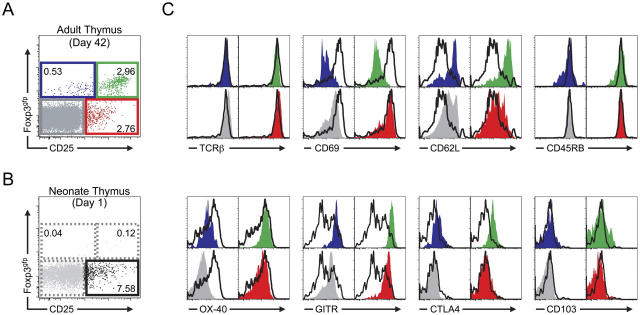
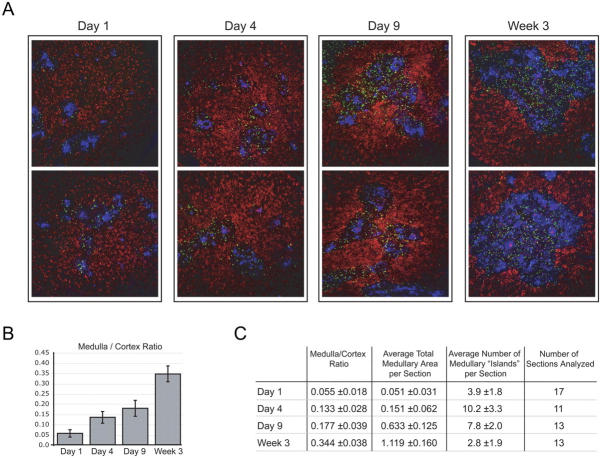
Thymectomy of neonatal mice can result in the development of autoimmune pathology. It has been proposed that thymic output of regulatory T (T reg) cells is delayed during ontogeny and that the development of autoimmune disease in neonatally thymectomized mice is caused by the escape of self-reactive T cells before thymectomy without accompanying T reg cells. However, the kinetics of T reg cell production within the thymus during ontogeny has not been assessed. We demonstrate that the development of Foxp3-expressing T reg cells is substantially delayed relative to nonregulatory thymocytes during ontogeny. Based on our data, we speculate that induction of Foxp3 in developing thymocytes and, thus, commitment to the T reg cell lineage is facilitated by a signal largely associated with the thymic medulla.


Figures

Figure 1.
Figure 1.
Appearance of Foxp3-expressing T reg cells is delayed during ontogeny. (A) Representative flow cytometric analysis of thymocytes from mice of the indicated age. Each column represents an individual mouse. The total live gate is shown in the CD4 × CD8 plot in the first row. All other plots are gated on the CD4 SP population indicated in the first row. The numbers indicate the percentage of cells in each gate. (B) Mean percentage of CD25+ or Foxp3gfp+ cells among CD4 SPs. (C) Mean percentage of Foxp3gfp+ cells among HSAloCD4 SPs. Error bars represent the mean ± SD. Data represent 5–7 mice analyzed per time point. Trend curves were derived using logarithmic least squares fitting of the mean values.
Figure 2.
Figure 2.
Phenotypic analysis of neonatal and adult CD4 SP thymocytes. (A) Representative flow cytometric analysis of CD25 and Foxp3gfp expression on CD4 SP thymocytes from a 6-wk-old mouse. The numbers indicate the percentage of cells in each gate. (B) Representative flow cytometric analysis of CD25 and Foxp3gfp expression on CD4 SP thymocytes from a 1-d-old mouse. The numbers indicate the percentage of cells in each gate. (C) Comparison of the indicated cell surface marker expression on postnatal day 1 CD25+Foxp3gfp− CD4 SPs with adult Foxp3/CD25-expressing subpopulations. Closed colored histograms are shown for cells from each of the adult Foxp3 × CD25 subpopulations and correspond to the gated population of the same color and position in the plot in A (blue, CD25lo/negFoxp3gfp+; green, CD25hiFoxp3gfp+; red, CD25+Foxp3gfp−; gray, CD25Foxp3gfp−). In every case, the open histogram overlay (black) shows the corresponding marker expression by the postnatal day 1 CD25+Foxp3gfp− CD4 SP population as defined by the bottom right gate in B.
Figure 3.
Figure 3.
Foxp3-expressing CD4 SPs appear coincidently with Foxp3-expressing DP thymocytes. Representative flow cytometric analysis of CD4 and CD8 expression on Foxp3gfp-expressing thymocytes from mice of the indicated age. Plots are gated on total live Foxp3gfp+ cells. The numbers indicate the percentage of cells in each gate.
Figure 4.
Figure 4.
Progressive increase in size and organization of thymic medulla during ontogeny. (A) Representative immunohistochemical analysis of thymic sections from mice of the indicated age. Foxp3gfp+ thymocytes (green, αGFP), thymic cortex (red, DEC-205), and thymic medulla (blue, Ep-CAM) are shown. Magnification = 10. (B) Mean medulla/cortex ratio in thymic sections from 1-, 4-, 9-d-old and 3-wk-old mice. Every fourth or fifth serial section of thymi from mice of the indicated age (three or four individual mice per time point) was stained for Ep-CAM and randomly chosen for morphometric analysis. Error bars represent the mean ± SD. (C) Mean medulla/cortex ratio, mean total medullary area (mm2), and mean number of medullary islands per section with standard deviations from the mean.

References

    1. Sakaguchi, S. 2004. Naturally arising CD4+ regulatory t cells for immunologic self-tolerance and negative control of immune responses. Annu. Rev. Immunol. 22:531–562. - PubMed
    1. Suri-Payer, E., A.Z. Amar, A.M. Thornton, and E.M. Shevach. 1998. CD4+CD25+ T cells inhibit both the induction and effector function of autoreactive T cells and represent a unique lineage of immunoregulatory cells. J. Immunol. 160:1212–1218. - PubMed
    1. Itoh, M., T. Takahashi, N. Sakaguchi, Y. Kuniyasu, J. Shimizu, F. Otsuka, and S. Sakaguchi. 1999. Thymus and autoimmunity: production of CD25+CD4+ naturally anergic and suppressive T cells as a key function of the thymus in maintaining immunologic self-tolerance. J. Immunol. 162:5317–5326. - PubMed
    1. Sakaguchi, S., K. Fukuma, K. Kuribayashi, and T. Masuda. 1985. Organ-specific autoimmune diseases induced in mice by elimination of T cell subset. I. Evidence for the active participation of T cells in natural self-tolerance; deficit of a T cell subset as a possible cause of autoimmune disease. J. Exp. Med. 161:72–87. - PMC - PubMed
    1. Asano, M., M. Toda, N. Sakaguchi, and S. Sakaguchi. 1996. Autoimmune disease as a consequence of developmental abnormality of a T cell subpopulation. J. Exp. Med. 184:387–396. - PMC - PubMed

Publication types

Substances