Comparative Study
. 2005 Oct 3;202(7):955-65.
doi: 10.1084/jem.20042433.

TIM-2 is expressed on B cells and in liver and kidney and is a receptor for H-ferritin endocytosis

Affiliations
Comparative Study

TIM-2 is expressed on B cells and in liver and kidney and is a receptor for H-ferritin endocytosis

Thomas T Chen et al. J Exp Med. .

Abstract

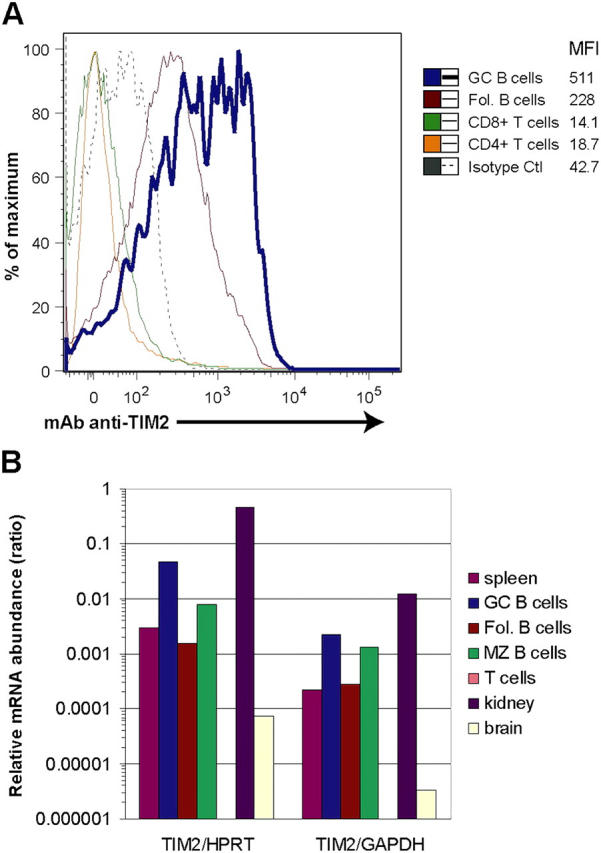
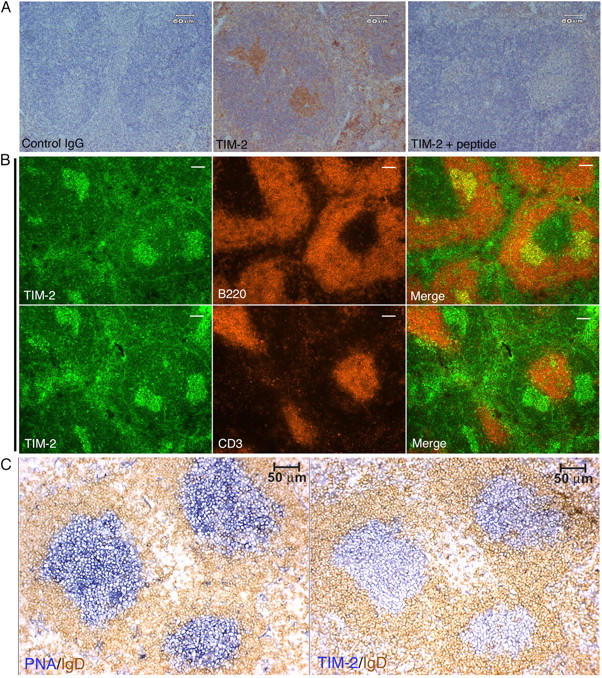
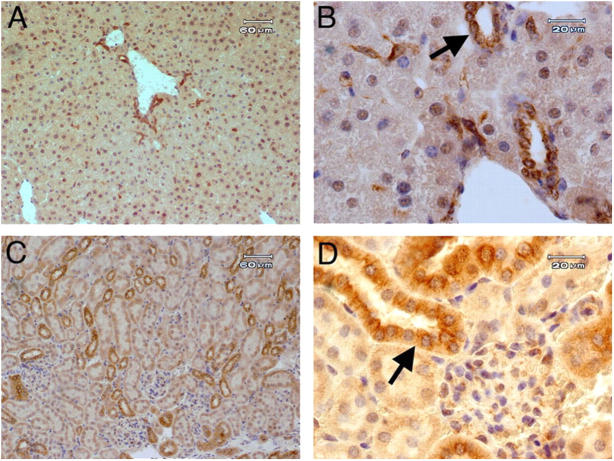
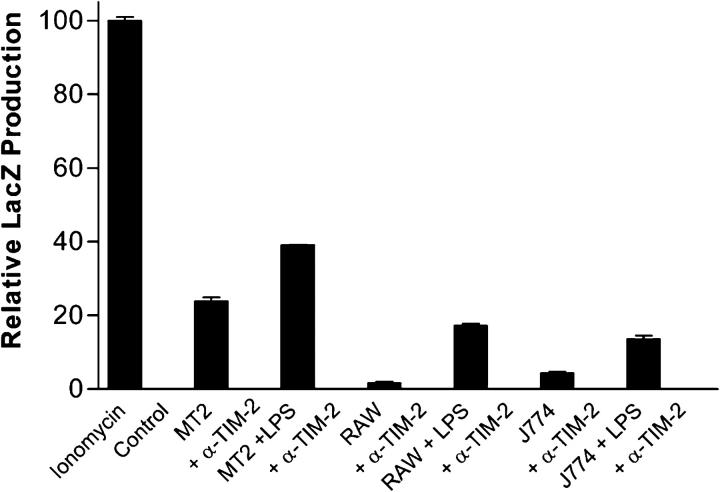
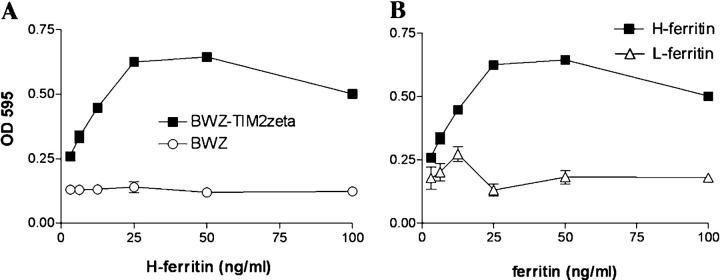
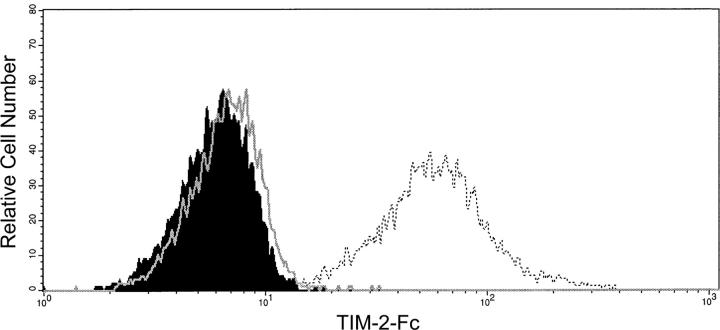
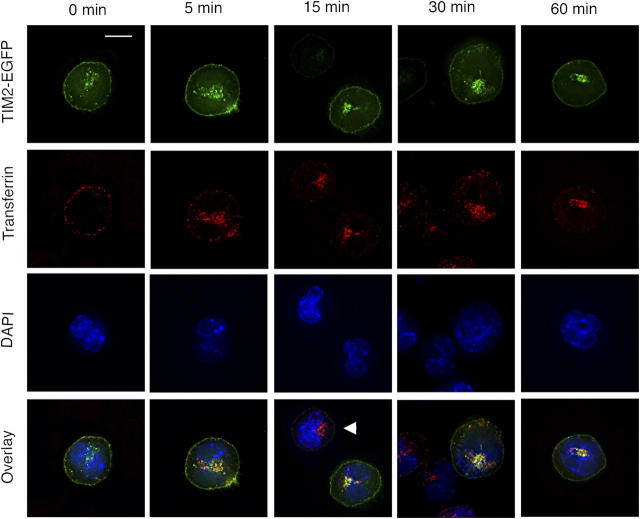
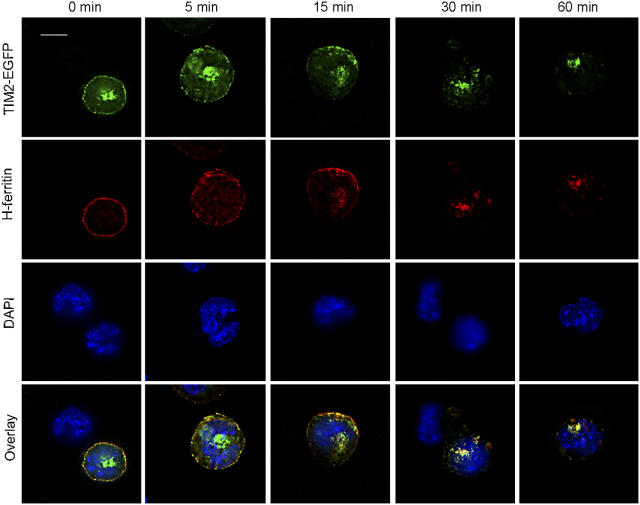
T cell immunoglobulin-domain and mucin-domain (TIM) proteins constitute a receptor family that was identified first on kidney and liver cells; recently it was also shown to be expressed on T cells. TIM-1 and -3 receptors denote different subsets of T cells and have distinct regulatory effects on T cell function. Ferritin is a spherical protein complex that is formed by 24 subunits of H- and L-ferritin. Ferritin stores iron atoms intracellularly, but it also circulates. H-ferritin, but not L-ferritin, shows saturable binding to subsets of human T and B cells, and its expression is increased in response to inflammation. We demonstrate that mouse TIM-2 is expressed on all splenic B cells, with increased levels on germinal center B cells. TIM-2 also is expressed in the liver, especially in bile duct epithelial cells, and in renal tubule cells. We further demonstrate that TIM-2 is a receptor for H-ferritin, but not for L-ferritin, and expression of TIM-2 permits the cellular uptake of H-ferritin into endosomes. This is the first identification of a receptor for ferritin and reveals a new role for TIM-2.


Figures

Figure 1.
Figure 1.
TIM-2 is expressed preferentially on GC B cells. (A) Flow cytometric analysis of TIM-2 expression on mouse spleen cells. Spleens were isolated 8 d after immunization with SRBCs. Each curve is normalized, so that the peaks are of equal height. Staining of GC cells is more than twice that of follicular B cells (Fol. B cells), although all B cells stain with anti–TIM-2, compared with an isotype control mAb (dotted line; the control shown is for GC B cells, but equivalent staining was seen with control staining of follicular B cells, not depicted). TIM-2 was not detected on CD4+ or CD8+ T cells. The numbers indicate geometric mean fluorescence intensity (MFI) for TIM-2 staining of each cell subset. (B) Quantitative RT-PCR analysis of TIM-2 expression. Total RNA was prepared from isolated subsets of spleen cells (sorted by FACS) or from isolated tissues, and was analyzed by quantitative RT-PCR. Expression of mRNA is shown as a ratio of TIM-2 mRNA/mRNA of two housekeeping genes, hypoxanthine-guanine phosphoribosyltransferase (HPRT) and GAPDH. Fol, follicular; MZ, marginal zone.
Figure 2.
Figure 2.
Immunohistochemistry and immunofluoresence for TIM-2 on spleen sections. (A) The anti–TIM-2 antiserum binds specifically to clusters of cells in splenic follicles. Paraffin-embedded sections from unimmunized mice were stained with an isotype-matched control rabbit antiserum (control IgG), anti–TIM-2 antiserum (TIM-2); or anti–TIM-2 antiserum blocked with an excess of the immunizing peptide (TIM-2 + peptide), followed by goat anti–rabbit IgG conjugated to horseradish peroxidase. The slides were counterstained with hematoxylin. (B) TIM-2–positive cells are predominantly B cells. Adjacent cryostat sections from unimmunized mice were co-stained for TIM-2 and B220 (top row) or TIM-2 and CD3 (bottom row). TIM-2 staining appears green (left columns), B220 and CD3 staining appear red (middle columns), and merged images are shown in the far right columns. Bars, 100 μm. (C) TIM-2–positive cells are localized to GCs. Adjacent cryostat sections from the spleen of a mouse that was immunized with SRBCs was stained for peanut agglutinin (PNA, blue, left panel) to show the GCs, and with IgD (brown, right panel) to show the surrounding follicular mantle zone. The section in the right panel was stained for TIM-2 (blue) and IgD (brown).
Figure 3.
Figure 3.
Immunohistochemistry demonstrates expression of TIM-2 in kidney and liver. Paraffin-embedded sections from normal mice were stained with anti–TIM-2 antiserum and counterstained with hematoxylin. Representative sections are shown from liver (A and B) or kidney (C and D). A and C, bars, 60 μm; B and D, bars, 20 μm. Staining for TIM-2 was blocked by the immunizing peptide. In B, the arrow indicates bile duct epithelial cells, and in D, the arrow indicates distal tubular epithelial cells; both were stained with anti–TIM-2.
Figure 4.
Figure 4.
Release of TIM-2 ligand by macrophage cell lines. MT2, RAW 264.7 (RAW), and J774 macrophage cell lines were cultured with or without LPS (100 ng/ml) for 24 h. Conditioned medium from these cells was used to stimulate the BWZ.TIM-2/CD3ζ reporter line for a period of 16 h. For blockade of ligand action, anti–TIM-2 (α-TIM-2) mAb was used at 50 μg/ml. All wells were supplemented with PMA (10 ng/ml). Data are plotted as lacZ production relative to that stimulated by ionomycin and normalized to PMA alone. Bars represent mean of triplicate samples, and error bars indicate standard error.
Figure 5.
Figure 5.
H-ferritin but not L-ferritin ligates TIM-2. (A) H-ferritin activates BWZ.TIM-2/CD3ζ reporter cells (black squares) but not untransfected BWZ cells (open circles). The BWZ.TIM-2/CD3ζ reporter cells and the untransfected BWZ cells responded equally to PMA and ionomycin (unpublished data). (B) Recombinant H-ferritin (black squares) but not L-ferritin (open triangles) activates BWZ.TIM-2/CD3ζ reporter cells.
Figure 6.
Figure 6.
TIM-2–FcIg fusion protein binds to CHO cells expressing H-ferritin on the cell surface. CHO.H-ferritin cells were stained with TIM-2–Fc (open curve, dashed) or with secondary antibody only (filled curve). Addition of anti–TIM-2 monoclonal mAb (50 μg/ml; open curve) reduced binding to levels seen with secondary antibody alone.
Figure 7.
Figure 7.
TIM-2 is expressed on the cell surface and in endosomes. BW5147 T cells (which lack TIM-2) were transfected with the gene for TIM-2, tagged at its COOH terminus with EGFP. Cells were exposed to transferrin, and coupled to the red dye Alexa-568, as a marker for endosomes. The figure shows the localization of TIM-2 and transferrin over the course of 1 h. As shown in the top row, TIM-2 localizes to the cell membrane and to localized intracellular compartments; this distribution is changed little by exposure to transferrin. As shown in the second row, transferrin is internalized largely within 15 min, identifying endosomes. In the third row, all cells are identified by staining of nuclei with DAPI. In the bottom row, fluorescence by TIM-2, transferrin, and DAPI are overlayed, demonstrating that the intracellular compartments expressing TIM-2 and transferrin are largely overlapping. Note that the panels for 15 and 30 min include, in addition to cells expressing TIM-2, cells that express little or no TIM-2 (arrowhead in 15-min panel). As expected, transferrin is endocytosed by TIM-2+ and TIM-2 cells. Bar, 10 μm.
Figure 8.
Figure 8.
H-ferritin is internalized by cells expressing TIM-2 but not by cells lacking TIM-2. The experiments used the same cell line as in Fig. 7, but here the cells were exposed to H-ferritin, identified by conjugation to Alexa-568. As shown in the top row, the distribution of TIM-2 on the cell surface becomes beaded within 5 min after incubation with H-ferritin; its expression on the cell surface declines thereafter. As shown in the second row, H-ferritin is internalized rapidly by cells expressing TIM-2. In the third row, all cells are identified by staining of nuclei with DAPI. In the bottom row, fluorescence by TIM-2, H-ferritin, and DAPI are overlayed. Note that the panels for 0 and 30 min include, in addition to cells expressing TIM-2, cells that express little or no TIM-2. Only cells expressing TIM-2 bind and internalize H-ferritin. The results are representative of four separate experiments. Bar, 10 μm.

References

    1. Feigelstock, D., P. Thompson, P. Mattoo, Y. Zhang, and G.G. Kaplan. 1998. The human homolog of HAVcr-1 codes for a hepatitis A virus cellular receptor. J. Virol. 72:6621–6628. - PMC - PubMed
    1. Ichimura, T., J.V. Bonventre, V. Bailly, H. Wei, C.A. Hession, R.L. Cate, and M. Sanicola. 1998. Kidney injury molecule-1 (KIM-1), a putative epithelial cell adhesion molecule containing a novel immunoglobulin domain, is up-regulated in renal cells after injury. J. Biol. Chem. 273:4135–4142. - PubMed
    1. Ichimura, T., C.C. Hung, S.A. Yang, J.L. Stevens, and J.V. Bonventre. 2004. Kidney injury molecule-1: a tissue and urinary biomarker for nephrotoxicant-induced renal injury. Am. J. Physiol. Renal Physiol. 286:F552–563. - PubMed
    1. Kuchroo, V.K., D.T. Umetsu, R.H. DeKruyff, and G.J. Freeman. 2003. The TIM gene family: emerging roles in immunity and disease. Nat. Rev. Immunol. 3:454–462. - PubMed
    1. Khademi, M., Z. Illes, A.W. Gielen, M. Marta, N. Takazawa, C. Baecher-Allan, L. Brundin, J. Hannerz, C. Martin, R.A. Harris, et al. 2004. T Cell Ig- and mucin-domain-containing molecule-3 (TIM-3) and TIM-1 molecules are differentially expressed on human Th1 and Th2 cells and in cerebrospinal fluid-derived mononuclear cells in multiple sclerosis. J. Immunol. 172:7169–7176. - PubMed

Publication types