. 2005 Oct;15(10):1365-72.
doi: 10.1101/gr.3832305.

Parallel adaptive evolution cultures of Escherichia coli lead to convergent growth phenotypes with different gene expression states

Affiliations

Parallel adaptive evolution cultures of Escherichia coli lead to convergent growth phenotypes with different gene expression states

Stephen S Fong et al. Genome Res. 2005 Oct.

Abstract

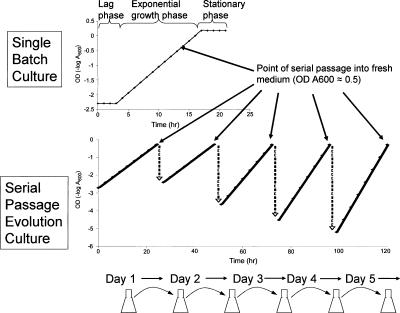
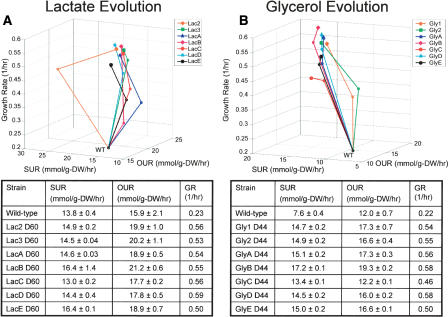
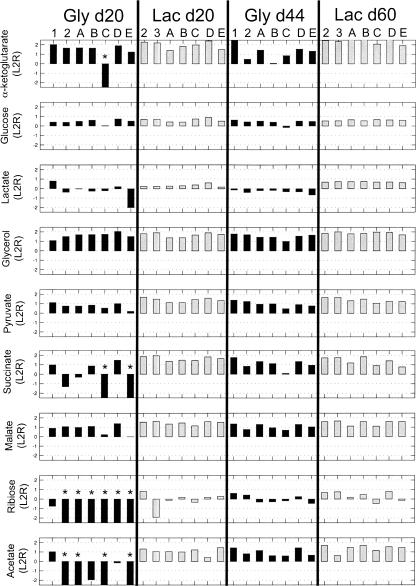
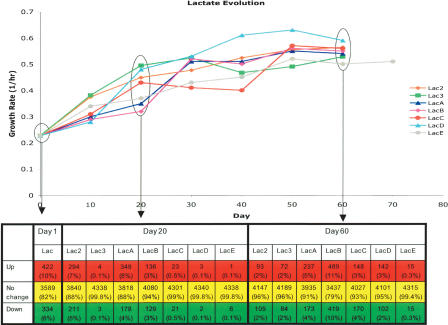
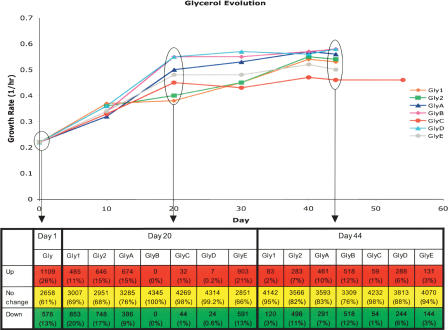
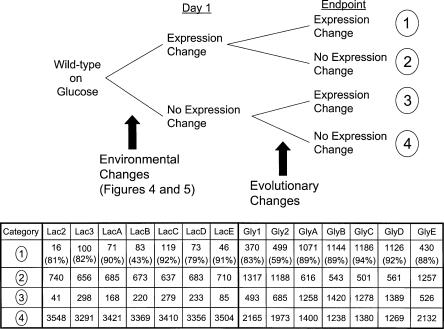
Laboratory evolution can be used to address fundamental questions about adaptation to selection pressures and, ultimately, the process of evolution. In this study, we investigated the reproducibility of growth phenotypes and global gene expression states during adaptive evolution. The results from parallel, replicate adaptive evolution experiments of Escherichia coli K-12 MG1655 grown on either lactate or glycerol minimal media showed that (1) growth phenotypes at the endpoint of evolution are convergent and reproducible; (2) endpoints of evolution have different underlying gene expression states; and (3) the evolutionary gene expression response involves a large number of compensatory expression changes and a smaller number of adaptively beneficial expression changes common across evolution strains. Gene expression changes initially showed a large number of differentially expressed genes in response to an environmental change followed by a return of most genes to a baseline expression level, leaving a relatively small set of differentially expressed genes at the endpoint that varied between evolved populations.


Figures

Figure 1.
Figure 1.
Schematic representation of the experimental evolutionary procedure. Prolonged exponential growth is maintained throughout the course of adaptive evolution by daily passage of cultures into fresh medium prior to entry into stationary phase. Inoculum at time of passage is adjusted to account for increasing growth rates (slope of log plot) over evolutionary time.
Figure 2.
Figure 2.
Fitness landscape depicting phenotype changes during evolution. Measured oxygen uptake rate (OUR, mmol/g-DW/hr) and substrate uptake rate (SUR, mmol/g-DW/hr) values form a plane with improved growth fitness indicated by growth rate (1/hr) on the z-axis. (A) L-lactate evolution populations were characterized at day 1, day 20, and day 60 of evolution. (B) Glycerol evolution populations were characterized at day 1, day 20, and day 44 of evolution. WT denotes the parental wild-type strain and endpoints of evolution are shown with filled symbols. Tables show phenotype measurements for the wild-type (unevolved) and endpoints of evolution with error shown as the standard deviation between replicate measurements.
Figure 3.
Figure 3.
Growth rate characterization of evolution populations on nonevolutionary substrates. Columns indicate individual populations grouped by the day of evolution and evolution substrate used. Rows show the substrate used for growth rate testing. Measurements for each population were compared with the growth rate of the wild-type strain and the log2 ratio is reported to compare growth rates. An asterisk (*) indicates cases where the evolved population exhibited slow, almost imperceptible growth relative to the wild-type strain.
Figure 4.
Figure 4.
Gene expression changes in lactate evolution populations throughout the course of adaptive evolution as compared with glucose wild-type expression profile. Growth rate changes throughout evolution are shown as a function of day of evolution with expression profiling performed at days 1, 20, and 60 of evolution. Significant expression changes from the wild-type strain grown on glucose were calculated by t-test using P-value cut-off corresponding to a false-discovery rate of 5%. By this calculation, the number of genes showing statistically significant expression changes tabulated below the plot at either increased expression compared with the wild-type (Up), decreased expression compared with the wild-type (Down), or no change in expression (No change). Percentages given in each cell indicated the percentage of genes falling within the category as a portion of the total genes.
Figure 5.
Figure 5.
Gene expression changes in glycerol evolution populations throughout the course of adaptive evolution as compared with glucose wild-type expression profile. Growth rate changes throughout evolution are shown as a function of day of evolution with expression profiling performed at days 1, 20, and 44 of evolution. Significant expression changes from the wild-type strain grown on glucose were calculated by t-test using P-value cut-off corresponding to a false-discovery rate of 5%. By this calculation, the number of genes showing statistically significant expression changes tabulated below the plot at either increased expression compared with the wild-type (Up), decreased expression compared with the wild-type (Down), or no change in expression (No change). Percentages given in each cell indicated the percentage of genes falling within the category as a portion of the total genes.
Figure 6.
Figure 6.
Evolutionary gene expression changes for lactate- and glycerol-evolved populations. Statistically significant gene expression changes between day 1 expression profiles and endpoint expression profiles (day 60 for lactate, day 44 for glycerol) were tabulated in four categories. Genes in category 1 had changed expression at day 1 in response to the environmental shift and had an additional change in expression during evolution. Genes in category 2 had changed expression at day 1 in response to the environmental shift but no additional expression change during evolution. Genes in category 3 only exhibited an expression change during evolution, and genes in category 4 showed no change in expression at either day 1 or at the endpoint of evolution. It should be noted that genes falling within category 1 can have expression changes during evolution that amplify expression changes observed at day 1 (larger magnitude change in same direction) or that compensate for expression changes at day 1 (similar magnitude change but in opposite direction). The percentage given for numbers in category 1 indicates the number of genes (e.g., 82%: 82 of the 100 genes in Lac3) exhibiting compensatory expression changes during evolution for that strain (i.e., initial environmental change caused increased expression and evolution led to decreased expression back to wild-type expression level).

References

    1. Benjamini, Y. and Hochberg, Y. 1995. Controlling the false discovery rate—A practical and powerful approach to multiple testing. J. R. Stat. Soc. B 57: 289-300.
    1. Cooper, V.S., Schneider, D., Blot, M., and Lenski, R.E. 2001. Mechanisms causing rapid and parallel losses of ribose catabolism in evolving populations of Escherichia coli B. J. Bacteriol. 183: 2834-2841. - PMC - PubMed
    1. Cooper, T.F., Rozen, D.E., and Lenski, R.E. 2003. Parallel changes in gene expression after 20,000 generations of evolution in Escherichia coli. Proc. Natl. Acad. Sci. 100: 1072-1077. - PMC - PubMed
    1. Cora, D., Di Cunto, F., Provero, P., Silengo, L., and Caselle, M. 2004. Computational identification of transcription factor binding sites by functional analysis of sets of genes sharing overrepresented upstream motifs. BMC Bioinformatics 5: 57. - PMC - PubMed
    1. Edwards, J.S., Ibarra, R.U., and Palsson, B.O. 2001. In silico predictions of Escherichia coli metabolic capabilities are consistent with experimental data. Nat. Biotechnol. 19: 125-130. - PubMed

Publication types