

Evidence for a selective sweep in the wapl region of Drosophila melanogaster
- PMID: 16204208
- PMCID: PMC1456153
- DOI: 10.1534/genetics.105.049346
Evidence for a selective sweep in the wapl region of Drosophila melanogaster
Abstract
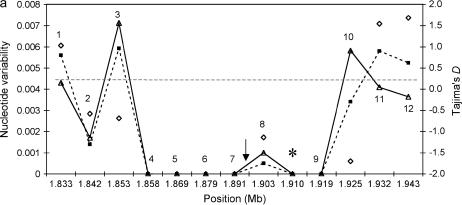
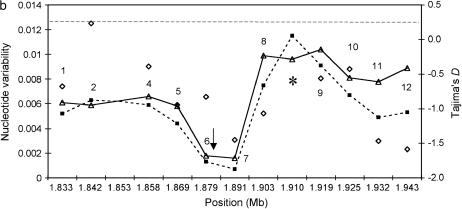
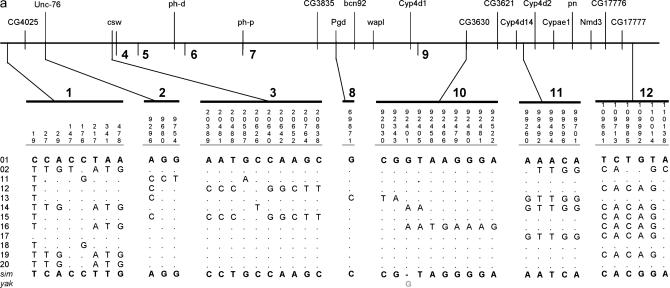
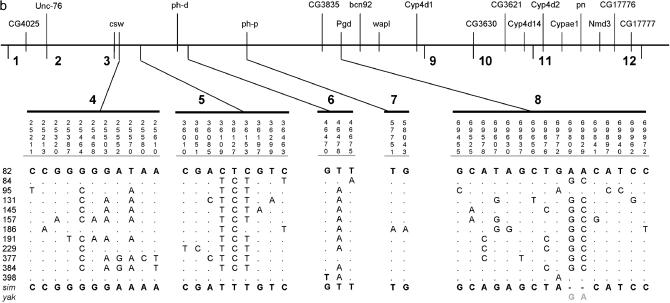
A scan of the X chromosome of a European Drosophila melanogaster population revealed evidence for the recent action of positive directional selection at individual loci. In this study we analyze one such region that showed no polymorphism in the genome scan (located in cytological division 2C10-2E1). We detect a 60.5-kb stretch of DNA encompassing the genes ph-d, ph-p, CG3835, bcn92, Pgd, wapl, and Cyp4d1, which almost completely lacks variation in the European sample. Loci flanking this region show a skewed frequency spectrum at segregating sites, strong haplotype structure, and high levels of linkage disequilibrium. Neutrality tests reveal that these data are unlikely under both the neutral equilibrium model and the simple bottleneck scenarios. In contrast, newly developed maximum-likelihood ratio tests suggest that strong selection has acted recently on the region under investigation, causing a selective sweep. Evidence that this sweep may have originated in an ancestral population in Africa is presented.
Figures
Similar articles
-
Evidence of gene conversion associated with a selective sweep in Drosophila melanogaster.Mol Biol Evol. 2006 Oct;23(10):1869-78. doi: 10.1093/molbev/msl069. Epub 2006 Jul 25. Mol Biol Evol. 2006. PMID: 16868022
-
Selective sweep in the Flotillin-2 region of European Drosophila melanogaster.PLoS One. 2013;8(2):e56629. doi: 10.1371/journal.pone.0056629. Epub 2013 Feb 21. PLoS One. 2013. PMID: 23437190 Free PMC article.
-
Patterns of sequence variability and divergence at the diminutive gene region of Drosophila melanogaster: complex patterns suggest an ancestral selective sweep.Genetics. 2007 Oct;177(2):1071-85. doi: 10.1534/genetics.106.069468. Epub 2007 Aug 24. Genetics. 2007. PMID: 17720938 Free PMC article.
-
Unusual pattern of nucleotide sequence variation at the OS-E and OS-F genomic regions of Drosophila simulans.Genetics. 2007 Apr;175(4):1923-35. doi: 10.1534/genetics.106.068015. Epub 2007 Feb 4. Genetics. 2007. PMID: 17277360 Free PMC article.
-
The recent demographic and adaptive history of Drosophila melanogaster.Heredity (Edinb). 2007 Feb;98(2):65-8. doi: 10.1038/sj.hdy.6800901. Epub 2006 Sep 27. Heredity (Edinb). 2007. PMID: 17006533 Review.
Cited by
-
Holding it together: rapid evolution and positive selection in the synaptonemal complex of Drosophila.BMC Evol Biol. 2016 May 5;16:91. doi: 10.1186/s12862-016-0670-8. BMC Evol Biol. 2016. PMID: 27150275 Free PMC article.
-
Genetic hitchhiking versus background selection: the controversy and its implications.Philos Trans R Soc Lond B Biol Sci. 2010 Apr 27;365(1544):1245-53. doi: 10.1098/rstb.2009.0278. Philos Trans R Soc Lond B Biol Sci. 2010. PMID: 20308100 Free PMC article. Review.
-
Molecular diversification in the quorum-sensing system of Vibrio cholerae: Role of natural selection in the emergence of pandemic strains.Appl Environ Microbiol. 2009 Jun;75(11):3808-12. doi: 10.1128/AEM.02496-08. Epub 2009 Apr 3. Appl Environ Microbiol. 2009. PMID: 19346342 Free PMC article.
-
Drosophila Evolution over Space and Time (DEST): A New Population Genomics Resource.Mol Biol Evol. 2021 Dec 9;38(12):5782-5805. doi: 10.1093/molbev/msab259. Mol Biol Evol. 2021. PMID: 34469576 Free PMC article.
-
Molecular population genetics of the NADPH cytochrome P450 reductase (CPR) gene in Anopheles minimus.Genetica. 2014 Aug;142(4):295-315. doi: 10.1007/s10709-014-9775-4. Epub 2014 Jul 20. Genetica. 2014. PMID: 25038863
References
-
- Andolfatto, P., 2001. Contrasting patterns of X-linked and autosomal nucleotide variation in Drosophila melanogaster and Drosophila simulans. Mol. Biol. Evol. 18: 279–290. - PubMed
-
- Baudry, E., B. Viginier and M. Veuille, 2004. Non-African populations of Drosophila melanogaster have a unique origin. Mol. Biol. Evol. 21: 1482–1491. - PubMed
-
- Begun, D. J., and C. F. Aquadro, 1992. Levels of naturally occurring DNA polymorphism correlate with recombination rates in D. melanogaster. Nature 356: 519–520. - PubMed
-
- Begun, D. J., and C. F. Aquadro, 1993. African and North American populations of Drosophila melanogaster are very different at the DNA level. Nature 365: 548–550. - PubMed
Publication types
MeSH terms
Substances
LinkOut - more resources
Full Text Sources
Molecular Biology Databases
Miscellaneous
