Comparative Study
. 2006 Jan;172(1):533-46.
doi: 10.1534/genetics.105.048439. Epub 2005 Oct 3.

Comparison of quantitative trait loci for adaptive traits between oak and chestnut based on an expressed sequence tag consensus map

Affiliations
Comparative Study

Comparison of quantitative trait loci for adaptive traits between oak and chestnut based on an expressed sequence tag consensus map

Manuela Casasoli et al. Genetics. 2006 Jan.

Abstract

A comparative genetic and QTL mapping was performed between Quercus robur L. and Castanea sativa Mill., two major forest tree species belonging to the Fagaceae family. Oak EST-derived markers (STSs) were used to align the 12 linkage groups of the two species. Fifty-one and 45 STSs were mapped in oak and chestnut, respectively. These STSs, added to SSR markers previously mapped in both species, provided a total number of 55 orthologous molecular markers for comparative mapping within the Fagaceae family. Homeologous genomic regions identified between oak and chestnut allowed us to compare QTL positions for three important adaptive traits. Colocation of the QTL controlling the timing of bud burst was significant between the two species. However, conservation of QTL for height growth was not supported by statistical tests. No QTL for carbon isotope discrimination was conserved between the two species. Putative candidate genes for bud burst can be identified on the basis of colocations between EST-derived markers and QTL.


Figures
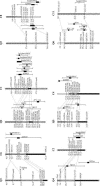
Figure 1.
Figure 1.
Homeologous linkage groups between Q. robur (Q) and C. sativa (C). Linkage groups were named as in Barreneche et al. (1998) and Casasoli et al. (2001). Oak linkage groups were taken as a reference and ordered from Q1 to Q12. Orthologous markers were linked by dotted lines. All orthologous markers mapped in this work and previously by Barreneche et al. (2004) were represented. Markers EST2T32, EST2T3, EST1T11, EST2T13, and CsCAT15 were not represented in oak linkage groups because they were mapped in a different mapping population as explained in the text. Marker ESTS08A01 was mapped in linkage group Q3 but it was not represented because its introduction perturbed marker order. This marker was orthologous to the EST Cons75 mapped in the homeologous linkage group C8. Common intervals identified by orthologous markers were filled with corresponding backgrounds in both oak and chestnut linkage groups. These homeologous genomic regions were used to identify corresponding QTL for adaptive traits in both species: each QTL is represented on the right of the linkage group by its confidence interval (95% confidence intervals, solid lines) and by the most probable position (rectangles on solid lines; see materials and methods). As previously described in materials and methods, the most probable position of the QTL was considered to identify unique QTL at the intraspecific level and, therefore, to perform comparative QTL mapping between the two species (i.e., QTL were considered conserved between oak and chestnut if their most probable position was included in the same homeologous interval identified by orthologous markers). QTL were represented and named as in Casasoli et al. (2004), Scotti-Saintagne et al. (2004), and O. Brendel (unpublished results). For oak QTL, ND was used to indicate bud burst QTL (number of days until the plant reached the phenotypic stage scored), and NF (number of flushes), LF (mean flush length), HI (total height increment), and H (total height) were used to indicate height growth QTL; δ13C_1 was used to indicate QTL for carbon isotope discrimination. Numbers 1, 2, and 3 following QTL names corresponded to three independent phenotypic assessments (Scotti-Saintagne et al. 2004). For chestnut QTL, bud and bud70 were used to name bud burst QTL (bud corresponded to the date of the first observed unfolded leaf; bud70 corresponded to the date when 70% of the tree buds showed an unfolded leaf); height (annual height increment) and heighttot (total plant height) were used to name height growth QTL; Δ was used to indicate QTL for carbon isotope discrimination. Numbers 2000, 2001, and 2002 following QTL names corresponded to three independent phenotypic assessments (Casasoli et al. 2004). Both in oak and in chestnut QTL names are followed by f (female) or m (male) to indicate the parental linkage map where QTL were originally detected. The figure was drawn using MapChart software (Voorrips 2002).
Figure 1.
Figure 1.
Homeologous linkage groups between Q. robur (Q) and C. sativa (C). Linkage groups were named as in Barreneche et al. (1998) and Casasoli et al. (2001). Oak linkage groups were taken as a reference and ordered from Q1 to Q12. Orthologous markers were linked by dotted lines. All orthologous markers mapped in this work and previously by Barreneche et al. (2004) were represented. Markers EST2T32, EST2T3, EST1T11, EST2T13, and CsCAT15 were not represented in oak linkage groups because they were mapped in a different mapping population as explained in the text. Marker ESTS08A01 was mapped in linkage group Q3 but it was not represented because its introduction perturbed marker order. This marker was orthologous to the EST Cons75 mapped in the homeologous linkage group C8. Common intervals identified by orthologous markers were filled with corresponding backgrounds in both oak and chestnut linkage groups. These homeologous genomic regions were used to identify corresponding QTL for adaptive traits in both species: each QTL is represented on the right of the linkage group by its confidence interval (95% confidence intervals, solid lines) and by the most probable position (rectangles on solid lines; see materials and methods). As previously described in materials and methods, the most probable position of the QTL was considered to identify unique QTL at the intraspecific level and, therefore, to perform comparative QTL mapping between the two species (i.e., QTL were considered conserved between oak and chestnut if their most probable position was included in the same homeologous interval identified by orthologous markers). QTL were represented and named as in Casasoli et al. (2004), Scotti-Saintagne et al. (2004), and O. Brendel (unpublished results). For oak QTL, ND was used to indicate bud burst QTL (number of days until the plant reached the phenotypic stage scored), and NF (number of flushes), LF (mean flush length), HI (total height increment), and H (total height) were used to indicate height growth QTL; δ13C_1 was used to indicate QTL for carbon isotope discrimination. Numbers 1, 2, and 3 following QTL names corresponded to three independent phenotypic assessments (Scotti-Saintagne et al. 2004). For chestnut QTL, bud and bud70 were used to name bud burst QTL (bud corresponded to the date of the first observed unfolded leaf; bud70 corresponded to the date when 70% of the tree buds showed an unfolded leaf); height (annual height increment) and heighttot (total plant height) were used to name height growth QTL; Δ was used to indicate QTL for carbon isotope discrimination. Numbers 2000, 2001, and 2002 following QTL names corresponded to three independent phenotypic assessments (Casasoli et al. 2004). Both in oak and in chestnut QTL names are followed by f (female) or m (male) to indicate the parental linkage map where QTL were originally detected. The figure was drawn using MapChart software (Voorrips 2002).

References

    1. Ahmadian, A., 2001. Approaches for Analysis of Mutations and Genetic Variations. Department of Biotechnology, Royal Institute of Technology, KTH, Stockholm.
    1. Alba, R., Z. Fei, P. Payton, Y. Liu, S. L. Moore et al., 2004. ESTs, cDNA microarrays, and gene expression profiling: tools for dissecting plant physiology and development. Plant J. 39: 697–714. - PubMed
    1. Altschul, S. F., W. Gish, W. Miller, E. W. Myers and D. J. Lipman, 1990. Basic local alignment search tool. J. Mol. Biol. 215: 403–410. - PubMed
    1. Arcade, A., A. Labourdette, M. Falque, B. Mangin, F. Chardon et al., 2004. BioMercator: integrating genetic maps and QTL towards discovery of candidate genes. Bioinformatics 20: 2324–2326. - PubMed
    1. Barakat, A., K. Szick-Miranda, I. F. Chang, R. Guyot, G. Blanc et al., 2001. The organization of cytoplasmic ribosomal protein genes in the Arabidopsis genome. Plant Physiol. 127: 398–415. - PMC - PubMed

Publication types

Substances