Comparative Study
. 2006 Jan 15;107(2):501-7.
doi: 10.1182/blood-2005-02-0655. Epub 2005 Oct 4.

Hematopoietic stem cells do not engraft with absolute efficiencies

Affiliations
Comparative Study

Hematopoietic stem cells do not engraft with absolute efficiencies

Fernando D Camargo et al. Blood. .

Abstract

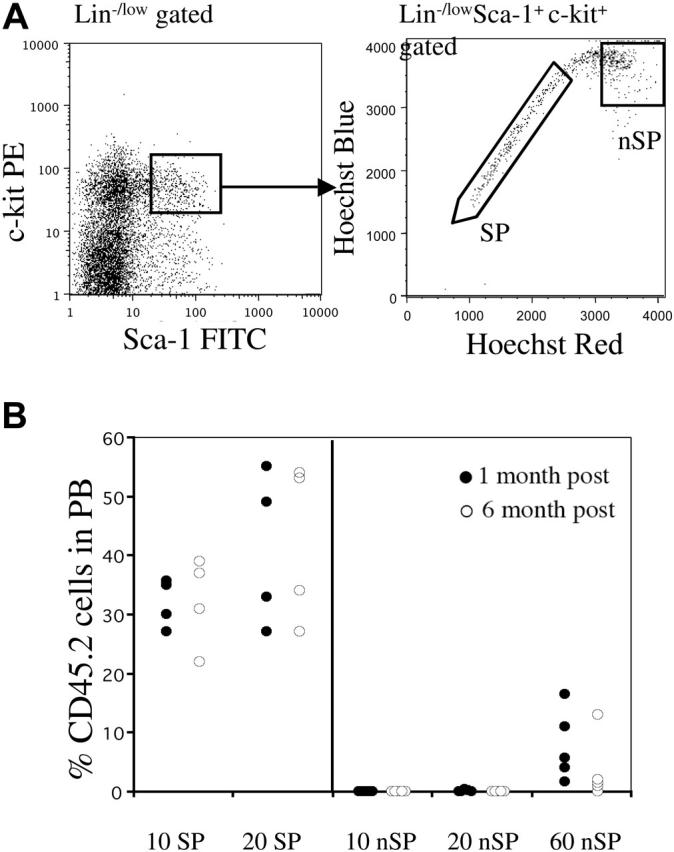
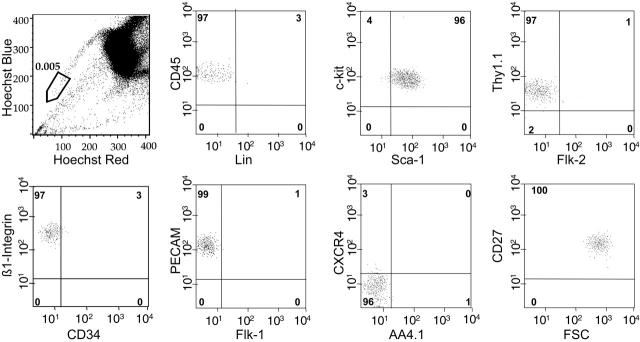
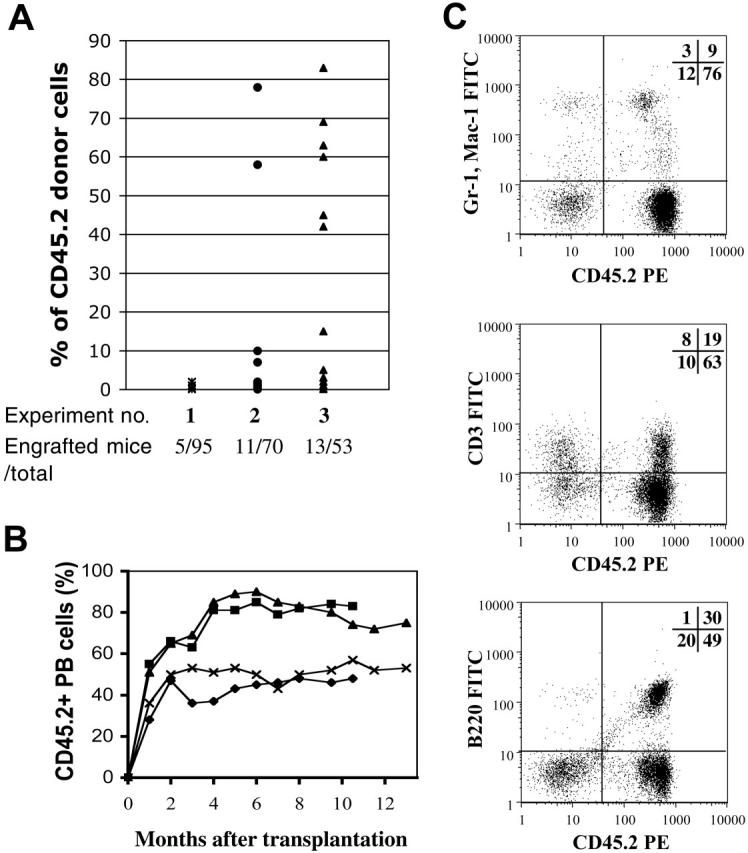
Hematopoietic stem cells (HSCs) can be isolated from murine bone marrow by their ability to efflux the Hoechst 33342 dye. This method defines an extremely small and hematopoietically potent subset of cells known as the side population (SP). Recent studies suggest that transplanted single SP cells are capable of lymphohematopoietic repopulation at near absolute efficiencies. Here, we carefully reevaluate the hematopoietic potential of individual SP cells and find substantially lower rates of reconstitution. Our strategy involved the cotransplantation of single SP cells along with different populations of competitor cells that varied in their self-renewal capacity. Even with minimized HSC competition, SP cells were only able to reconstitute up to 35% of recipient mice. Furthermore, through immunophenotyping and clonal in vitro assays we find that SP cells are virtually homogeneous. Isolation of HSCs on the basis of Hoechst exclusion and a single cell-surface marker allows enrichment levels similar to that obtained with complex multicolor strategies. Altogether, our results indicate that even an extremely homogeneous HSC population, based on phenotype and dye efflux, cannot reconstitute mice at absolute efficiencies.


Figures

Figure 1.
Figure 1.
Only SP cells within the KSL population contain LT-HSCs. (A) Whole bone marrow was stained with antibodies against c-Kit, Sca-1, and lineages. The KSL population represented approximately 0.1% of nucleated cells. Right panel shows Hoechst profile of KSL-gated cells. Approximately 25% to 35% of cells fell into the SP gate. Regions marked as SP and non-SP (nSP) were sorted and then re-sorted for transplantation experiments. (B) Reconstitution profiles of mice that received transplants of limited cell numbers of KSL-SP or KSL non-SP cells along with a radioprotective dose of 1 × 10⁵ host-type whole bone marrow cells. Peripheral blood chimerism is shown at 1 month (•), or 6 months (○) after transplantation.
Figure 2.
Figure 2.
Dye efflux directly correlates with self-renewal. SP cells from Sca-1–enriched bone marrow (A) were stained with anti–Mac-1PE and anti-CD4APC antibodies. When the SP is subdivided into the geometrically similar regions R1 to R3, the percentage of cells in R1 is lowest, as indicated. Mac-1 and CD4 expression on the gated subpopulations is shown. (B) All CD45.2 Sca-1+ SP cells, independent of their R gate status, were sorted on the basis of Mac-1 expression and transplanted into CD45.1 lethally irradiated recipients along with 1 × 10⁵ CD45.1 WBM cells. A representative analysis of 2 different experiments is shown from animals transplanted with 20 Mac-1 (•) or 20 Mac-1low (○) SP cells. Engraftment values from the 2 different populations are statistically different (P < .005), except for the 4-week time point (P < .3, t test).
Figure 3.
Figure 3.
SPlow cells are phenotypically a homogeneous population. SPlow cells as gated in the top left panel usually represented the lowest 10% of SP cells in a given sort, with a bone marrow frequency of approximately 0.005% to 0.007%. Cell-surface marker expression on more than 500 SPlow cells was analyzed, with the percentages shown in the relevant quadrants. A representative analysis, out of at least 3 performed for each marker, is exhibited.
Figure 4.
Figure 4.
Long-term multilineage reconstitution by a single SP. Single SPlow cells as shown in Figure 3, also selected for Sca-1 expression, were sorted into wells of a 96-well plate and transplanted into lethally irradiated recipients. (A) Carrier cells for the different transplantation experiments were as follows: (1) 2 × 10⁵ WBM; (2) 1-3 × 10⁵ Sca-1+ c-Kit+ depleted; and (3) 600 or 1000 LinSca-1+ c-Kit+ CD34+. Donor chimerism was determined as the percentage of CD45.2+ cells of the total number of CD45+ peripheral blood cells. Dots represent engrafted mice at 6 months after single-cell transfer. (B) Representative long-term follow up of 4 single HSC transplant recipients. Chimerism in peripheral blood was assessed by CD45.2 staining. Each line represents an individual mouse. (C) Lineage analysis in 1 representative chimera with 85% PB contribution 4 months after one HSC transplantation demonstrates contribution to the myeloid (top), T-cell (middle), and B-cell (bottom) lineages. Numbers represent the percentage of cells in each quadrant.
Figure 5.
Figure 5.
SP cells are homogeneous for CD34 expression. (A) Nonspecific staining at high concentrations of RAM34 antibody. Wild-type (WT) and CD34-null BM cells were stained with Hoechst and subsequently stained with standard concentrations (0.2 μg) of anti-lineage, Sca-1, c-kit, and the indicated concentrations of RAM34-FITC. Histograms shown are gated on KLS-SP cells. Numbers within each panel represent the mean fluorescent intensity (MFI) for the FITC channel. (B) No difference in CD34 mRNA expression within SP cells. Whole bone marrow from wild-type mice (top left) was stained with Hoechst and antibodies against c-kit, Sca-1 lineage markers, and RAM34-FITC at 2.5μg/106 cells. SP cells (gated as in left panel) that were lineage, c-kit+, and Sca-1+ were displayed for CD34 and sorted with the gates shown (top right). (C) Representative reanalysis of sorted CD34 and CD34+ cells. (D) CD34 mRNA levels of sorted populations were analyzed by real-time PCR. Error bars represent SD. P < .5 (t test).

Comment in

References

    1. Jordan CT, Lemischka IR. Clonal and systemic analysis of long-term hematopoiesis in the mouse. Genes Dev. 1990;4: 220-232. - PubMed
    1. Lemischka IR, Raulet DH, Mulligan RC. Developmental potential and dynamic behavior of hematopoietic stem cells. Cell. 1986;45: 917-927. - PubMed
    1. Osawa M, Hanada K, Hamada H, Nakauchi H. Long-term lymphohematopoietic reconstitution by a single CD34-low/negative hematopoietic stem cell. Science. 1996;273: 242-245. - PubMed
    1. Morrison S, Weissman I. The long-term repopulating subset of hematopoietic stem cells is deterministic and isolatable by phenotype. Immunity. 1994;1: 661-673. - PubMed
    1. Okada S, Nakauchi H, Nagayoshi K, Nishikawa S, Miura Y, Suda T. In vivo and in vitro stem cell function of c-kit- and Sca-1-positive murine hematopoietic cells. Blood. 1992;80: 3044-3050. - PubMed

Publication types