. 2005 Oct 4;33(17):5533-43.
doi: 10.1093/nar/gki852. Print 2005.

Evidence for a preferential targeting of 3'-UTRs by cis-encoded natural antisense transcripts

Affiliations

Evidence for a preferential targeting of 3'-UTRs by cis-encoded natural antisense transcripts

Miao Sun et al. Nucleic Acids Res. .

Abstract

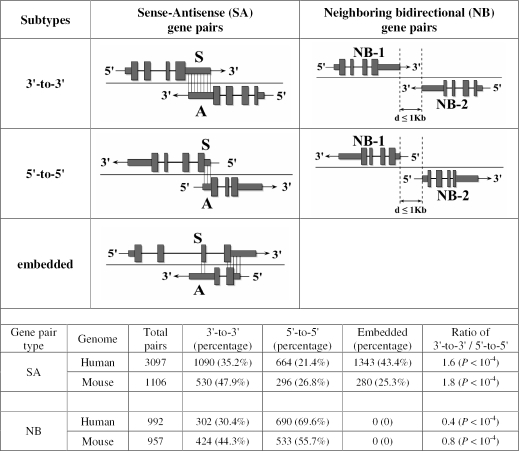
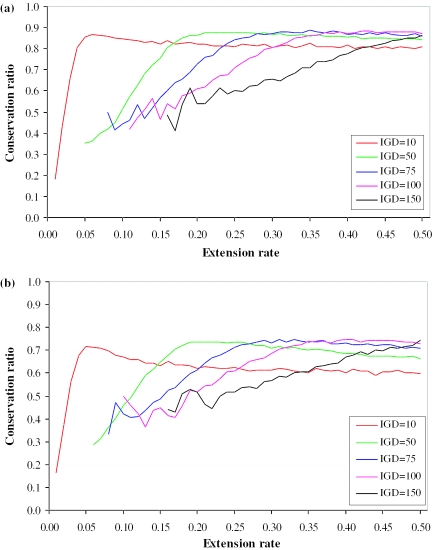
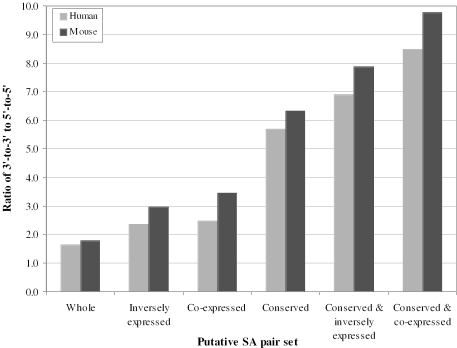
Although both the 5'- and 3'-untranslated regions (5'- and 3'-UTRs) of eukaryotic mRNAs may play a crucial role in posttranscriptional gene regulation, we observe that cis-encoded natural antisense RNAs have a striking preferential complementarity to the 3'-UTRs of their target genes in mammalian (human and mouse) genomes. A null neutral model, evoking differences in the rate of 3'-UTR and 5'-UTR extension, could potentially explain high rates of 3'-to-3' overlap compared with 5'-to-5' overlap. However, employing a simulation model we show that this null model probably cannot explain the finding that 3'-to-3' overlapping pairs have a much higher probability (>5 times) of conservation in both mouse and human genomes with the same overlapping pattern than do 5'-to-5' overlaps. Furthermore, it certainly cannot explain the finding that overlapping pairs seen in both genomes have a significantly higher probability of having co-expression and inverse expression (i.e. characteristic of sense-antisense regulation) than do overlapping pairs seen in only one of the two species. We infer that the function of many 3'-to-3' overlaps is indeed antisense regulation. These findings underscore the preference for, and conservation of, 3'-UTR-targeted antisense regulation, and the importance of 3'-UTRs in gene regulation.


Figures

Figure 1
Figure 1
Classification and comparison of subtypes of putative SA and NB gene pairs. Based on the overlapping pattern, we divide putative SA pairs into three subtypes: 3′-to-3′ (i.e. tail-to-tail overlap), 5′-to-5′ (i.e. head-to-head overlap) and embedded (one gene is entirely embedded within the other) pairs. Based on the orientation pattern, we divide NB gene pairs into two subtypes: 3′-to-3′ (i.e. tail-to-tail orientated) and 5′-to-5′ (i.e. head-to-head orientated) pairs. Indeed, 3′-to-3′ and 5′-to-5′ putative SA pairs largely represent 3′- and 5′-UTR-targeted putative SA pairs, respectively (Materials and Methods). Coding exons are represented by blocks connected by horizontal lines representing introns. The 5′- and 3′-UTRs are displayed as thinner blocks on the leading and trailing ends of the aligning regions. The distributions and comparison of the subtypes in putative SA and NB pairs are shown in the embedded table. Because many antisense genes have only EST sequences, the proportion of ‘embedded’ putative SA pairs is seriously overestimated here. In fact, a large proportion of the ‘embedded’ putative SA pairs are also mainly overlapping at the 3′-UTRs of the sense genes (data not shown). Regardless of the ‘embedded’ pairs, the 3′-to-3′ putative SA pairs have a significantly higher percentage compared with the 5′-to-5′ putative SA pairs in both genomes. In contrast, a reverse pattern was observed in NB gene pairs.
Figure 2
Figure 2
The proportion of SA pairs found in both lineages in simulation as a function of the extension rate for different values of IGD. For (a) the re-arrangement rate per unit time is set to 1/1000 in one lineage and 1/5000 in the other. For (b), it is 1/500 in one lineage and 1/1000 in the other. Red lines are for IGD of 10 U, green for 50 U, blue for 75 U, magenta for 100 U and black for 150 U. Only instances in which >10 overlapping pairs out of 10 000 simulants are incorporated in the analysis.
Figure 3
Figure 3
Analysis of the ratio of 3′-to-3′ to 5′-to-5′ among different classes of putative SA pair sets. In both genomes, compared with that in the whole putative SA pair set, the percentage of 3′-to-3′ putative SA pairs increases in inversely expressed, co-expressed, and especially conserved putative SA pair sets, while the percentage of 5′-to-5′ putative SA pairs decreases (Table 3). As a result, the ratio of 3′-to-3′ to 5′-to-5′ pair significantly increases from 1.6 and 1.8 in the whole putative SA set, to 8.5 and 9.8 in the conserved and co-expressed putative SA pair set in the human and mouse genome, respectively.

References

    1. Waterston R.H., Lindblad-Toh K., Birney E., Rogers J., Abril J.F., Agarwal P., Agarwala R., Ainscough R., Alexandersson M., An P., et al. Initial sequencing and comparative analysis of the mouse genome. Nature. 2002;420:520–562. - PubMed
    1. International Human Genome Sequencing Consortium. Finishing the euchromatic sequence of the human genome. Nature. 2004;431:931–945. - PubMed
    1. Levinen M., Tjian R. Transcription regulation and animal diversity. Nature. 2003;424:147–151. - PubMed
    1. Mattick J.S. Non-coding RNAs: the architects of eukaryotic complexity. EMBO Rep. 2001;2:986–991. - PMC - PubMed
    1. Mattick J.S. RNA regulation: a new genetics? Nature Rev Genet. 2004;5:316–323. - PubMed

Publication types