. 2005 Oct 4;33(17):5553-64.
doi: 10.1093/nar/gki857. Print 2005.

UVA-visible photo-excitation of guanine radical cations produces sugar radicals in DNA and model structures

Affiliations

UVA-visible photo-excitation of guanine radical cations produces sugar radicals in DNA and model structures

Amitava Adhikary et al. Nucleic Acids Res. .

Abstract

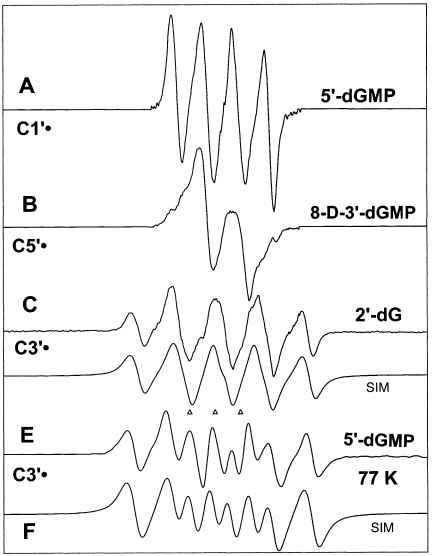
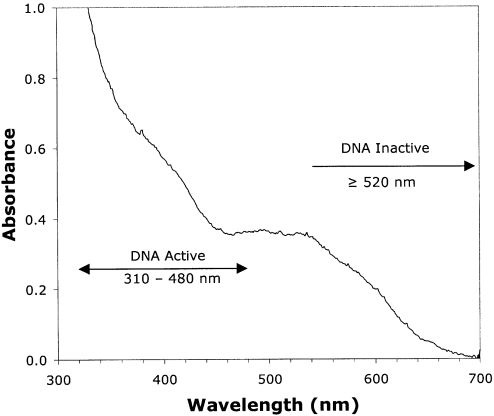
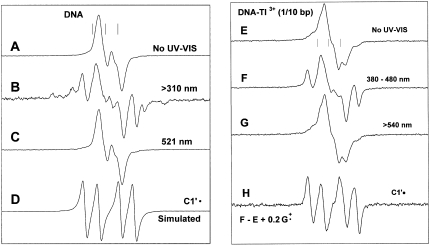
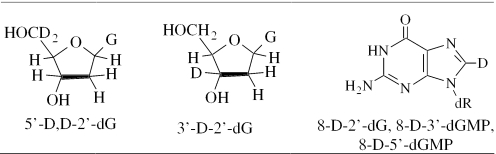
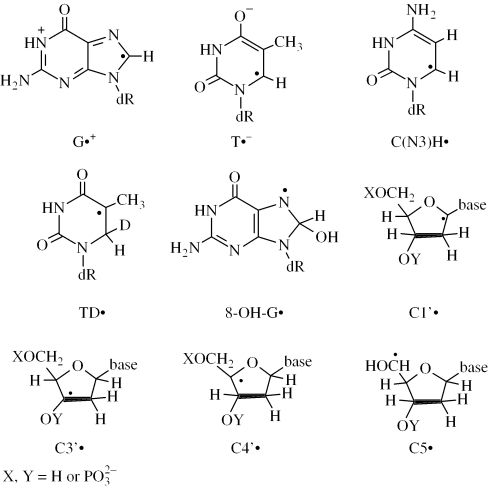
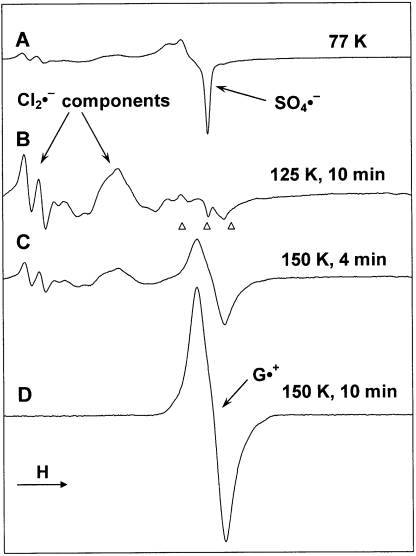
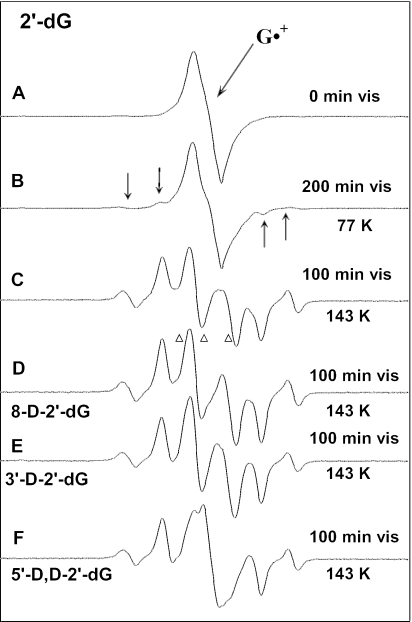
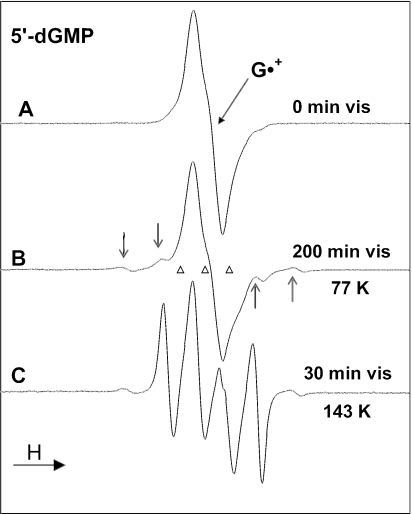
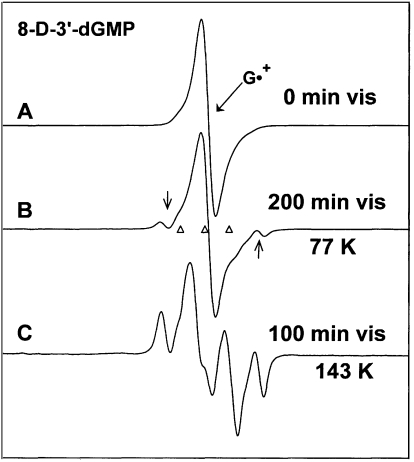
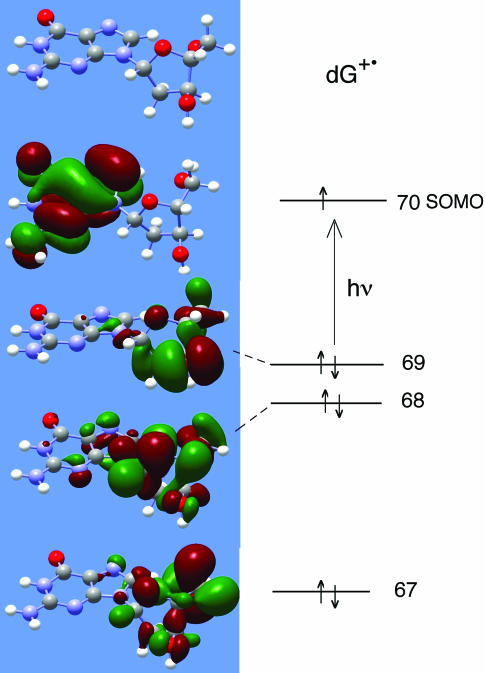
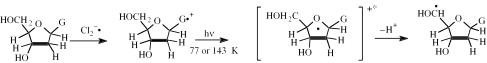
This work presents evidence that photo-excitation of guanine radical cations results in high yields of deoxyribose sugar radicals in DNA, guanine deoxyribonucleosides and deoxyribonucleotides. In dsDNA at low temperatures, formation of C1'* is observed from photo-excitation of G*+ in the 310-480 nm range with no C1'* formation observed > or =520 nm. Illumination of guanine radical cations in 2'dG, 3'-dGMP and 5'-dGMP in aqueous LiCl glasses at 143 K is found to result in remarkably high yields (approximately 85-95%) of sugar radicals, namely C1'*, C3'* and C5'*. The amount of each of the sugar radicals formed varies dramatically with compound structure and temperature of illumination. Radical assignments were confirmed using selective deuteration at C5' or C3' in 2'-dG and at C8 in all the guanine nucleosides/tides. Studies of the effect of temperature, pH, and wavelength of excitation provide important information about the mechanism of formation of these sugar radicals. Time-dependent density functional theory calculations verify that specific excited states in G*+ show considerable hole delocalization into the sugar structure, in accord with our proposed mechanism of action, namely deprotonation from the sugar moiety of the excited molecular radical cation.


Figures

Figure 1
Figure 1
Benchmark spectra used for computer analysis. (A) C1′•, produced from G•+ in 5′-dGMP. (B) C5′•, produced from G•+ in 8-D-3′-dGMP (C) C3′•, produced from G•+ in 2′-dG. (D) Computer simulated spectra of C3′•, to match experimental spectrum of C. (E) C3′•, found after photo-excitation of G•+ at 77 K in 5′-dGMP. (F) Computer simulated spectra of C3′•, to match experimental spectrum of E. (See Table 1 and Appendix for details).
Figure 2
Figure 2
The UV-visible absorption spectrum of G•+ produced by Cl2 oxidation of 2′-dG, as described in Materials and Methods, at 77 K in 7 M LiCl/D2O.
Figure 3
Figure 3
(A) ESR spectrum of DNA ice samples (50 mg/ml D2O) γ-irradiated to 15.4 kGy dose, annealed to 130 K to eliminate •OH. (B) After illumination at 77 K for 1 h with light >310 nm. (C) After illumination of an identically prepared sample as in (A), at 521 nm for 30 min. (D) Simulated spectrum of C1′• using the parameters shown in Table 1. This spectrum matches line components in spectrum B. (E) ESR spectrum of DNA (50 mg/ml) with 1 Tl3+/10 base pairs γ-irradiated to 15.4 kGy dose, annealed to 130 K to eliminate •OH. (F) After illumination, at 77 K, of the sample in E with 380–480 nm light for 110 min; (G) After illumination, at 77 K, of an identically prepared sample as in E, using light with wavelength >540 nm, for 30 min. (H) Subtraction of E from F, plus addition of 0.2G•+ showing the growth of the spectrum from C1′•; addition of the G•+ spectrum added compensates for its loss in F on photolysis.
Scheme 1
Scheme 1
Isotopically substituted compounds used.
Scheme 2
Scheme 2
Radicals described.
Figure 4
Figure 4
(A) ESR spectrum showing SO4 and Cl2 formation in γ-irradiated (2.5 kGy) sample of a nucleoside (5′-D,D-2′-dG) in the presence of K2S2O8 in a 7 M N2-saturated LiCl/D2O glass. (B) Spectrum of the sample in (A) after annealing to 125 K for ∼10 min. (C) After further annealing at 150 K for 4 min. (D) After annealing for another 6 min (i.e. total 10 min) at 150 K. Only the spectrum of G•+ is observed at this point. All ESR spectra were recorded at 77 K.
Figure 5
Figure 5
(A) Spectrum of G•+ in 2′-dG before illumination; (B) after visible illumination at 77 K of G•+ in 2′-dG. Arrows indicate four outer line components from C3′•. (C) After visible illumination at 143 K of a new sample of G•+ in 2′-dG, showing a nearly complete conversion to sugar radicals (Table 4). A central doublet assigned to C5′• is present. (D) Spectrum after visible illumination at 143 K of G•+ in 8-D-2′-dG. A central doublet from C5′• is present. (E) Spectrum after visible illumination at 143 K of G•+ in 3′-D-2′-dG. The central doublet from C5′• is also present here, but with a slightly smaller splitting than that observed in 2′-dG (Figure 5C) and in 8-D-2′-dG (Figure 5D). (F) After visible illumination at 143 K of G•+ in 5′-D,D-2′-dG. The central doublet from C5′• has collapsed to a singlet. All ESR spectra are recorded at 77 K. The sample in (A) is red–violet; those in (C–F) were colorless.
Figure 6
Figure 6
(A) ESR spectrum from G•+ in 5′-dGMP. (B) Spectrum after photo-excitation at 77 K with visible light, giving a small amount of C3′• (arrows show four outer components from C3′•) and C1′• (Table 4). (C) After photo-excitation, at 143 K, of a fresh sample of G•+, showing 95% conversion of G•+ to sugar radicals, primarily C1′• (prominent quartet) (see text and Table 4). The sample in (A) is red–violet whereas that in (C) is colorless.
Figure 7
Figure 7
(A) ESR spectrum of G•+ in 8-D-3′-dGMP. The deuteron at C8 causes this spectrum to be sharper than other G•+ spectra shown. (B) After visible light illumination at 77 K. Two C1′• line components are visible (arrows). (C) After illumination, at 143 K, of a fresh sample of G•+, showing a composite spectrum from (C5′•) (central doublet, 50%), C1′• (quartet, 35%) and G•+ (15%). Subtractions of the C1′• and the G•+ spectra from (7C) result in spectrum 1B, the benchmark for C5′•.
Figure 8
Figure 8
Molecular orbitals and energy level filling diagram for G•+ in 2′-dG. MOs were computed by TD-DFT (6–31G*, B3LYP) and visualized via Gaussview. The SOMO shows the expected MO for G•+ with the hole localized on the guanine base. A number of inner shell MOs are localized on the sugar ring, as shown (Table 3).
Scheme 3
Scheme 3
Mechanism of sugar radical formation using formation of C5′• as an example.

References

    1. Kanaar R., Hoeijmakers J.H., van Gent D.C. Molecular mechanisms of DNA double strand break repair. Trends Cell. Biol. 1998;8:483–489. - PubMed
    1. Frankenberg D., Frankenberg-Schwager M., Blöcher D., Harbich R. Evidence for DNA double-strand breaks as the critical lesions in yeast cells irradiated with sparsely or densely ionizing radiation under oxic or anoxic conditions. Radiat. Res. 1981;88:524–532. - PubMed
    1. Ward J.F. The complexity of DNA damage: relevance to biological consequences. Int. J. Radiat. Biol. 1994;66:427–432. - PubMed
    1. Frankenberg-Schwager M., Kirchermeier D., Greif G., Baer K., Becker M., Frankenberg D. Toxicology. Vol. 212. 2005. Cisplatin-mediated DNA double-strand breaks in replicating but not in quiescent cells of the yeast Saccharomyces cerevisiae; pp. 175–184. - PubMed
    1. Pogozelski W.K., Tullius T.D. Oxidative strand scission of nucleic acids: routes initiated by hydrogen abstraction from the sugar moiety. Chem. Rev. 1998;98:1089–1107. - PubMed

Publication types