. 2005 Oct;71(10):6427-30.
doi: 10.1128/AEM.71.10.6427-6430.2005.

Deletion of the sigB gene in Bacillus cereus ATCC 14579 leads to hydrogen peroxide hyperresistance

Affiliations

Deletion of the sigB gene in Bacillus cereus ATCC 14579 leads to hydrogen peroxide hyperresistance

Willem van Schaik et al. Appl Environ Microbiol. 2005 Oct.

Abstract

The sigB gene of Bacillus cereus ATCC 14579 encodes the alternative sigma factor sigma(B). Deletion of sigB in B. cereus leads to hyperresistance to hydrogen peroxide. The expression of katA, which encodes one of the catalases of B. cereus, is upregulated in the sigB deletion mutant, and this may contribute to the hydrogen peroxide-resistant phenotype.


Figures
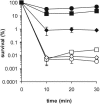
FIG. 1.
FIG. 1.
Survival rates of B. cereus ATCC 14579 and B. cereus FM1400 during exposure to H2O2. The survival rates of B. cereus ATCC 14579 cells (open symbols) and the cells of sigB deletion mutant B. cereus FM1400 (closed symbols) were determined upon exposure to H2O2. Cells were grown until the mid-exponential growth phase either aerobically or anaerobically. Aerobically grown cultures were exposed to 10 mM H2O2 in the mid-exponential growth phase (circles) or after a heat shock from 30°C to 42°C for 30 min (squares). Anaerobically grown cultures were exposed to 2 mM H2O2 (diamonds). The averages of three independent experiments are shown. The error bars indicate standard deviations.
FIG. 3.
FIG. 3.
Visualization of catalase activity on a native polyacrylamide gel. Cell-free protein extracts were isolated from B. cereus ATCC 14579 (WT) and B. cereus FM1400 (−sigB) cells in the mid-exponential growth phase in BHI (me) and after a 30-min exposure to 42°C (hs). Proteins (100 μg) were separated on a nondenaturing 10% polyacrylamide gel and stained for catalases as described by Woodbury et al. (27), resulting in light catalase bands against a dark background. The large arrow points to the main vegetative-cell catalase. The small arrow points to the σB-dependent catalase KatE.
FIG. 4.
FIG. 4.
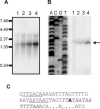
Transcriptional analysis of katA of B. cereus. (A) Northern blot analysis of the transcription of katA. Total RNA was extracted from B. cereus ATCC 14579 and B. cereus FM1400 cells during mid-exponential growth in BHI (lane 1 and 3, respectively) and after a 10-min exposure to 42°C (lane 2 and 4, respectively). A 32P-labeled internal PCR product of katA was used as a probe. Hybridization of the probe with target RNA was visualized by exposure to a Phosphoscreen and scanning with a Storm scanner. Marker sizes (in kb) are indicated. (B) Primer extension analysis of the promoters 5′ of katA. Total RNA was extracted from B. cereus ATCC 14579 and B. cereus FM1400 cells during mid-exponential growth in BHI (lane 1 and 3, respectively) and after a 10-min exposure to 42°C (lane 2 and 4, respectively). The mapped transcriptional start site is indicated with an arrow. The lanes labeled A, C, G, and T are the corresponding sequencing ladder for the localization of the transcripts. (C) Sequence of the promoter 5′ of katA. Identified −35 and −10 regions are underlined. Bold type indicates the mapped transcriptional start site. The putative PerR-binding site is indicated in italics. The spacing to the ATG start codon of katA is also indicated.
FIG. 2.
FIG. 2.
Catalase activity in B. cereus ATCC 14579 and B. cereus FM1400. Levels of catalase activity of whole cells of B. cereus ATCC 14579 (WT) and B. cereus FM1400 (−sigB) were determined. Levels of catalase activity of aerobically (+O2) grown cells in the mid-exponential growth phase in BHI (me) and after a 30-min heat shock from 30°C to 42°C (hs) were determined. Catalase activity of cells grown in anaerobic (−O2) culture was also determined. Cells were pelleted by centrifugation, washed once in PBS, and resuspended in PBS containing 40 mM H2O2. One unit of catalase activity was defined as a decrease in the absorbance at 240 nm of 1 per minute and adjusted for the OD600 of the cultures. The averages of three independent experiments are shown. The error bars indicate standard deviations.

Similar articles

Cited by

References

    1. Baillie, A., and J. R. Norris. 1963. Studies of enzyme changes during sporulation in Bacillus cereus, using starch gel electrophoresis. J. Appl. Bacteriol. 26:102-106.
    1. Beers, R. F., and I. W. Sizer. 1952. A spectrophotometric method for measuring the breakdown of hydrogen peroxide by catalase. J. Biol. Chem. 195:133-140. - PubMed
    1. Bsat, N., A. Herbig, L. Casillas-Martinez, P. Setlow, and J. D. Helmann. 1998. Bacillus subtilis contains multiple Fur homologues: identification of the iron uptake (Fur) and peroxide regulon (PerR) repressors. Mol. Microbiol. 29:189-198. - PubMed
    1. Chelikani, P., I. Fita, and P. C. Loewen. 2004. Diversity of structures and properties among catalases. Cell. Mol. Life Sci. 61:192-208. - PMC - PubMed
    1. Chen, L., L. Keramati, and J. D. Helmann. 1995. Coordinate regulation of Bacillus subtilis peroxide stress genes by hydrogen peroxide and metal ions. Proc. Natl. Acad. Sci. USA 92:8190-8194. - PMC - PubMed

LinkOut - more resources