

Evidence that the plant cannabinoid Delta9-tetrahydrocannabivarin is a cannabinoid CB1 and CB2 receptor antagonist
- PMID: 16205722
- PMCID: PMC1751228
- DOI: 10.1038/sj.bjp.0706414
Evidence that the plant cannabinoid Delta9-tetrahydrocannabivarin is a cannabinoid CB1 and CB2 receptor antagonist
Abstract
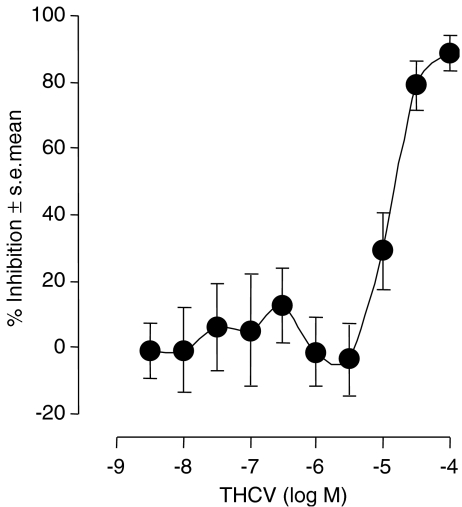
Delta9-tetrahydrocannabivarin (THCV) displaced [(3)H]CP55940 from specific binding sites on mouse brain and CHO-hCB(2) cell membranes (K(i)=75.4 and 62.8 nM, respectively).THCV (1 microM) also antagonized CP55940-induced stimulation of [(35)S]GTPgammaS binding to these membranes (apparent K(B)=93.1 and 10.1 nM, respectively). In the mouse vas deferens, the ability of Delta9-tetrahydrocannabinol (THC) to inhibit electrically evoked contractions was antagonized by THCV, its apparent K(B)-value (96.7 nM) approximating the apparent K(B)-values for its antagonism of CP55940- and R-(+)-WIN55212-induced stimulation of [(35)S]GTPgammaS binding to mouse brain membranes. THCV also antagonized R-(+)-WIN55212, anandamide, methanandamide and CP55940 in the vas deferens, but with lower apparent K(B)-values (1.5, 1.2, 4.6 and 10.3 nM, respectively).THCV (100 nM) did not oppose clonidine, capsaicin or (-)-7-hydroxy-cannabidiol-dimethylheptyl-induced inhibition of electrically evoked contractions of the vas deferens. Contractile responses of the vas deferens to phenylephrine hydrochloride or beta,gamma-methylene-ATP were not reduced by 1microM THCV or R-(+)-WIN55212, suggesting that THCV interacts with R-(+)-WIN55212 at prejunctional sites. At 32 microM, THCV did reduce contractile responses to phenylephrine hydrochloride and beta,gamma-methylene-ATP, and above 3 microM it inhibited electrically evoked contractions of the vas deferens in an SR141716A-independent manner. In conclusion, THCV behaves as a competitive CB(1) and CB(2) receptor antagonist. In the vas deferens, it antagonized several cannabinoids more potently than THC and was also more potent against CP55940 and R-(+)-WIN55212 in this tissue than in brain membranes. The bases of these agonist- and tissue-dependent effects remain to be established.
Figures


Comment in
-
Plant cannabinoids: a neglected pharmacological treasure trove.Br J Pharmacol. 2005 Dec;146(7):913-5. doi: 10.1038/sj.bjp.0706415. Br J Pharmacol. 2005. PMID: 16205721 Free PMC article.
Similar articles
-
The psychoactive plant cannabinoid, Delta9-tetrahydrocannabinol, is antagonized by Delta8- and Delta9-tetrahydrocannabivarin in mice in vivo.Br J Pharmacol. 2007 Mar;150(5):586-94. doi: 10.1038/sj.bjp.0707124. Epub 2007 Jan 22. Br J Pharmacol. 2007. PMID: 17245367 Free PMC article.
-
Evidence that the plant cannabinoid cannabigerol is a highly potent alpha2-adrenoceptor agonist and moderately potent 5HT1A receptor antagonist.Br J Pharmacol. 2010 Jan;159(1):129-41. doi: 10.1111/j.1476-5381.2009.00515.x. Epub 2009 Dec 4. Br J Pharmacol. 2010. PMID: 20002104 Free PMC article.
-
Structure-activity relationship for the endogenous cannabinoid, anandamide, and certain of its analogues at vanilloid receptors in transfected cells and vas deferens.Br J Pharmacol. 2001 Feb;132(3):631-40. doi: 10.1038/sj.bjp.0703850. Br J Pharmacol. 2001. PMID: 11159715 Free PMC article.
-
The diverse CB1 and CB2 receptor pharmacology of three plant cannabinoids: delta9-tetrahydrocannabinol, cannabidiol and delta9-tetrahydrocannabivarin.Br J Pharmacol. 2008 Jan;153(2):199-215. doi: 10.1038/sj.bjp.0707442. Epub 2007 Sep 10. Br J Pharmacol. 2008. PMID: 17828291 Free PMC article. Review.
-
Are cannabidiol and Δ(9) -tetrahydrocannabivarin negative modulators of the endocannabinoid system? A systematic review.Br J Pharmacol. 2015 Feb;172(3):737-53. doi: 10.1111/bph.12944. Br J Pharmacol. 2015. PMID: 25257544 Free PMC article.
Cited by
-
The Structure-Function Relationships of Classical Cannabinoids: CB1/CB2 Modulation.Perspect Medicin Chem. 2016 Jun 28;8:17-39. doi: 10.4137/PMC.S32171. eCollection 2016. Perspect Medicin Chem. 2016. PMID: 27398024 Free PMC article.
-
In vitro and in vivo pharmacology of synthetic olivetol- or resorcinol-derived cannabinoid receptor ligands.Br J Pharmacol. 2006 Oct;149(4):431-40. doi: 10.1038/sj.bjp.0706888. Epub 2006 Sep 4. Br J Pharmacol. 2006. PMID: 16953186 Free PMC article.
-
Structural basis of Δ9-THC analog activity at the Cannabinoid 1 receptor.Res Sq [Preprint]. 2024 May 21:rs.3.rs-4277209. doi: 10.21203/rs.3.rs-4277209/v1. Res Sq. 2024. Update in: Nat Commun. 2025 Jan 8;16(1):486. doi: 10.1038/s41467-024-55808-4. PMID: 38826401 Free PMC article. Updated. Preprint.
-
Δ8-Tetrahydrocannabivarin prevents hepatic ischaemia/reperfusion injury by decreasing oxidative stress and inflammatory responses through cannabinoid CB2 receptors.Br J Pharmacol. 2012 Apr;165(8):2450-61. doi: 10.1111/j.1476-5381.2011.01410.x. Br J Pharmacol. 2012. PMID: 21470208 Free PMC article.
-
Cannabidiol displays unexpectedly high potency as an antagonist of CB1 and CB2 receptor agonists in vitro.Br J Pharmacol. 2007 Mar;150(5):613-23. doi: 10.1038/sj.bjp.0707133. Epub 2007 Jan 22. Br J Pharmacol. 2007. PMID: 17245363 Free PMC article.
References
-
- BREIVOGEL C.S., GRIFFIN G., DI MARZO V., MARTIN B.R. Evidence for a new G protein-coupled cannabinoid receptor in mouse brain. Mol. Pharmacol. 2001;60:155–163. - PubMed
-
- CHENG Y.-C., PRUSOFF W.H. Relationship between the inhibition constant (KI) and the concentration of inhibitor which causes 50 percent inhibition (IC50) of an enzymatic reaction. Biochem. Pharmacol. 1973;22:3099–3108. - PubMed
-
- DEVANE W.A., HANUS L., BREUER A., PERTWEE R.G., STEVENSON L.A., GRIFFIN G., GIBSON D., MANDELBAUM A., ETINGER A., MECHOULAM R. Isolation and structure of a brain constituent that binds to the cannabinoid receptor. Science. 1992;258:1946–1949. - PubMed
-
- ELSOHLY M.A.Chemical constituents of Cannabis Cannabis and Cannabinoids. Pharmacology, Toxicology and Therapeutic Potential 2002New York: Haworth Press, Inc; 27–36.ed. Grotenhermen, F. & Russo, E. pp
-
- GILL E.W., PATON W.D.M., PERTWEE R.G. Preliminary experiments on the chemistry and pharmacology of cannabis. Nature. 1970;228:134–136. - PubMed
Publication types
MeSH terms
Substances
Grants and funding
LinkOut - more resources
Full Text Sources
Other Literature Sources
