Comparative Study
. 2005;7(5):R1001-13.
doi: 10.1186/ar1776. Epub 2005 Jun 22.

Differential expression of chemokine receptors on peripheral blood B cells from patients with rheumatoid arthritis and systemic lupus erythematosus

Affiliations
Comparative Study

Differential expression of chemokine receptors on peripheral blood B cells from patients with rheumatoid arthritis and systemic lupus erythematosus

Maren Henneken et al. Arthritis Res Ther. 2005.

Abstract

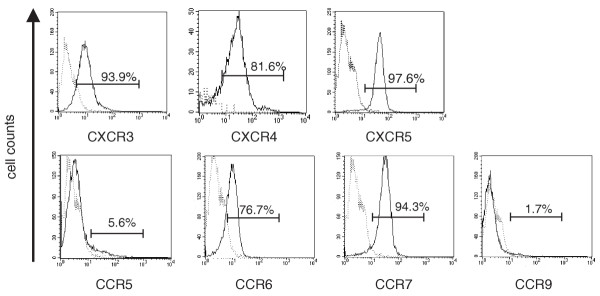
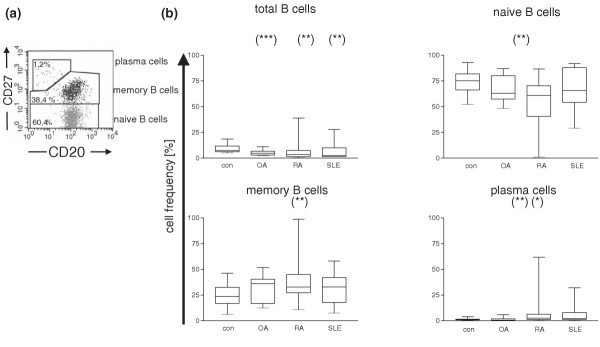
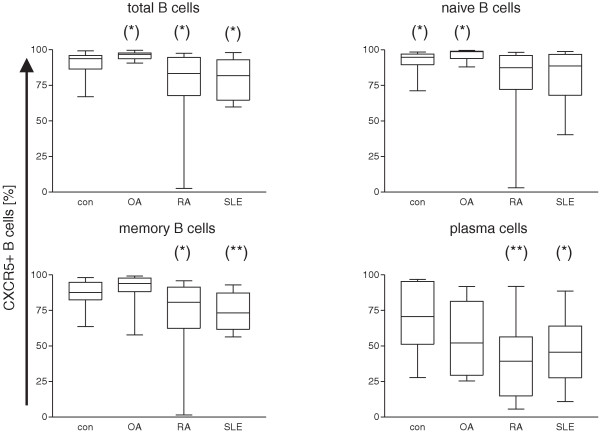
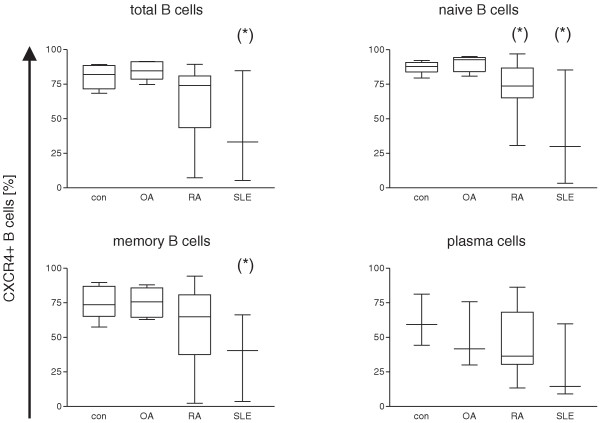
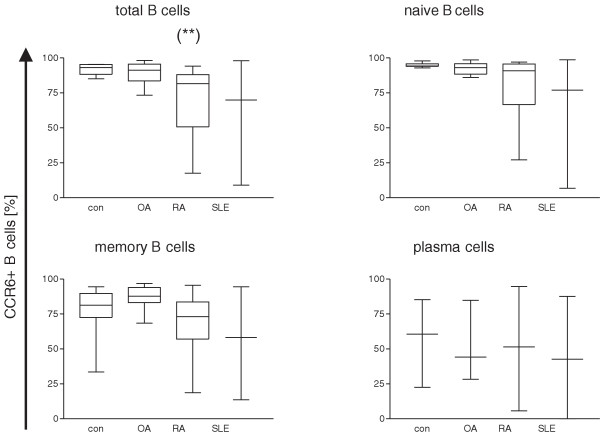
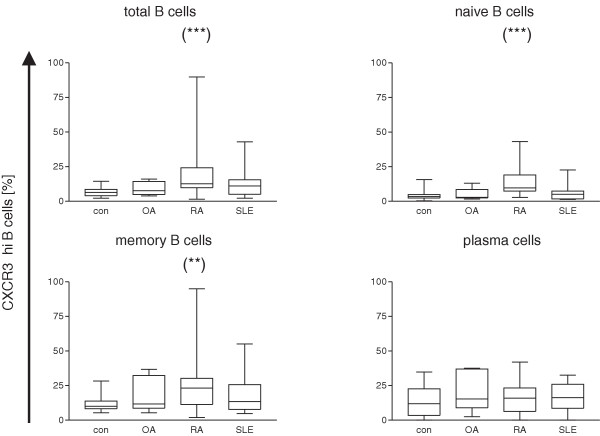
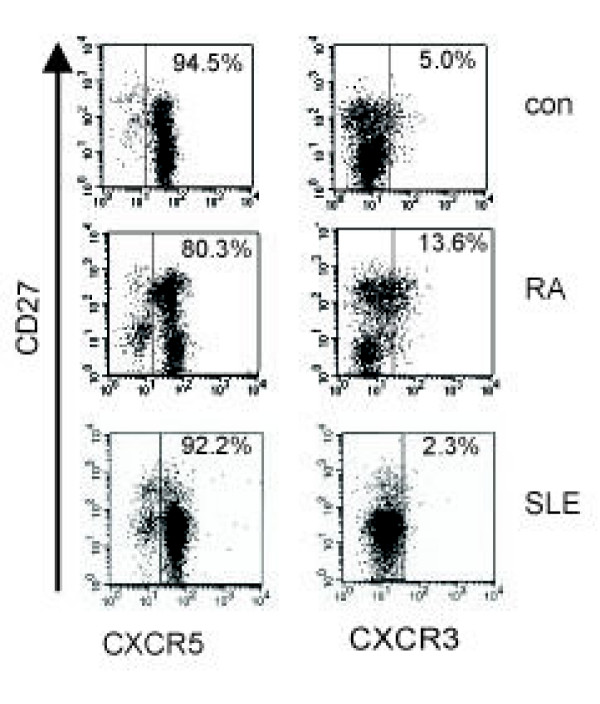
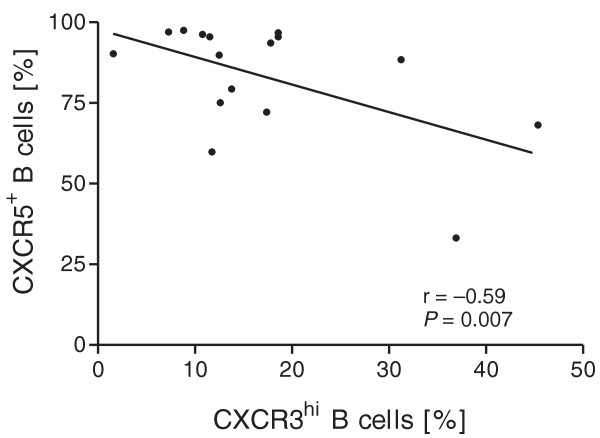
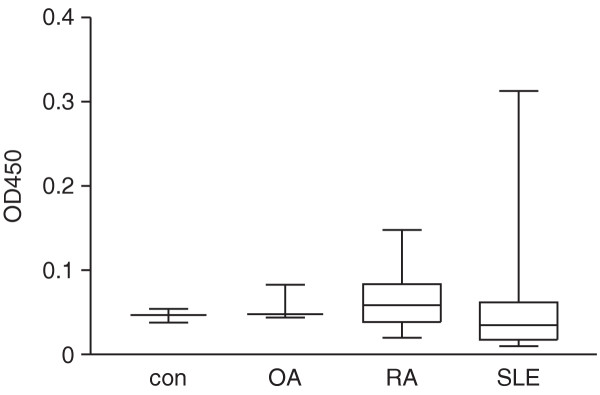
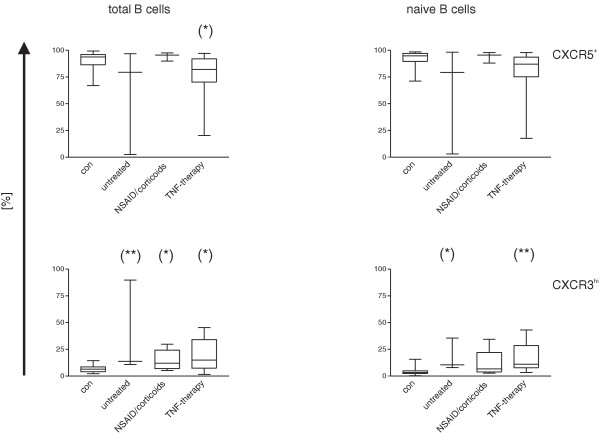
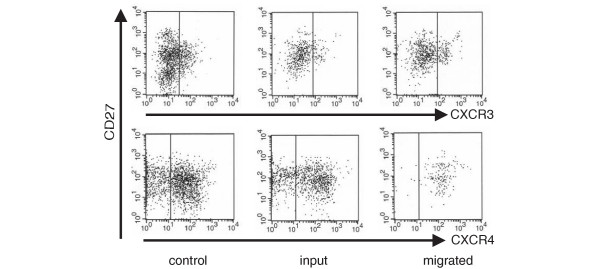
Chemokines and their receptors are essential in the recruitment and positioning of lymphocytes. To address the question of B cell migration into the inflamed synovial tissue of patients with rheumatoid arthritis (RA), peripheral blood naive B cells, memory B cells and plasma cells were analyzed for cell surface expression of the chemokine receptors CXCR3, CXCR4, CXCR5, CCR5, CCR6, CCR7 and CCR9. For comparison, B cells in the peripheral blood of patients with the autoimmune disease systemic lupus erythematosus (SLE) or with the degenerative disease osteoarthritis (OA) were analyzed. Expression levels of chemokine receptors were measured by flow cytometry and were compared between the different patient groups and healthy individuals. The analysis of chemokine receptor expression showed that the majority of peripheral blood B cells is positive for CXCR3, CXCR4, CXCR5, CCR6 and CCR7. Whereas a small fraction of B cells were positive for CCR5, practically no expression of CCR9 was found. In comparison with healthy individuals, in patients with RA a significant fraction of B cells showed a decreased expression of CXCR5 and CCR6 and increased levels of CXCR3. The downregulation of CXCR5 correlated with an upregulation of CXCR3. In patients with SLE, significant changes in CXCR5 expression were seen. The functionality of the chemokine receptors CXCR3 and CXCR4 was demonstrated by transmigration assays with the chemokines CXCL10 and CXCL12, respectively. Our results suggest that chronic inflammation leads to modulation of chemokine receptor expression on peripheral blood B cells. However, differences between patients with RA and patients with SLE point toward a disease-specific regulation of receptor expression. These differences may influence the migrational behavior of B cells.


Figures

Figure 1
Figure 1
Expression of chemokine receptors in peripheral blood B cells from a healthy donor. Flow cytometric plots show chemokine receptor expression on CD19+ B cells. For each of the chemokine receptors tested the percentage of positive B cells is indicated. Isotype control (dotted line) is included.
Figure 2
Figure 2
The frequency of B cells in healthy individuals and the different patient groups. (a) Triple staining with CD19, CD20 and CD27 was used to define naive B cells, memory B cells and plasma cells. Thresholds for CD27-, CD27+ and CD27hi are indicated. (b) Frequency for B cells and the different subpopulations. Data are given for healthy individuals (con) and for each of the patient groups analyzed: osteoarthritis (OA), rheumatoid arthritis (RA) and systemic lupus erythematosus (SLE). Box plots show the median values, 25th and 75th quartile and the range of values. Significant differences from controls are shown (*P < 0.05, **P < 0.005, ***P < 0.0005).
Figure 3
Figure 3
Chemokine receptor CXCR5+ expression on B cell subpopulations. The percentage of total B cells, naive B cells, memory B cells and plasma cells expressing CXCR5+ are given. Box plots show the median values, 25th and 75th quartile and the range of values. Significant differences from controls are shown (*P < 0.05, **P < 0.005).
Figure 4
Figure 4
Chemokine receptor CXCR4+ expression on B cell subpopulations. The percentage of total B cells, naive B cells, memory B cells and plasma cells expressing CXCR4+ are given. Box plots show the median values, 25th and 75th quartile and the range of values. Significant differences from controls are shown (*P < 0.05).
Figure 5
Figure 5
Chemokine receptor CCR6+ expression on B cell subpopulations. The percentage of total B cells, naive B cells, memory B cells and plasma cells expressing CCR6+ are given. Box plots show the median values, 25th and 75th quartile and the range of values. Significant differences from controls are shown (**P < 0.005).
Figure 6
Figure 6
Chemokine receptor CXCR3hi expression on B cell subpopulations. The percentage of total B cells, naive B cells, memory B cells and plasma cells expressing CXCR3hi are given. Box plots show the median values, 25th and 75th quartile and the range of values. Significant differences from controls are shown (**P < 0.005, ***P < 0.0005).
Figure 7
Figure 7
Modulation of CXCR3 and CXCR5 expression in patients. A representative fluorescence-activated cell sorting analysis for chemokine receptor expression on peripheral B cells (CD19+) is shown. The percentages of CXCR5+ and CXCR3hi B cells are given for healthy controls (con) and patients with osteoarthritis (OA), rheumatoid arthritis (RA) and systemic lupus erythematosus (SLE).
Figure 8
Figure 8
Negative correlation in the frequency of CXCR3hi and CXCR5+ B cells in patients with RA. Correlation factor (Spearman's) and P value are indicated (GraphPad software).
Figure 9
Figure 9
CXCL10 concentrations in sera. Sera of healthy controls and of patients with rheumatoid arthritis, systemic lupus erythematosus and osteoarthritis were tested in a standard ELISA test. A D450 of 0.06 corresponds to 200 pg/ml CXCL10 (concentration after Ficoll centrifugation); for each of the groups analyzed median values are indicated. Con, control; OA, osteoarthritis; RA, rheumatoid arthritis; SLE, systemic lupus erythematosus.
Figure 10
Figure 10
Effect of treatment on CXCR3 and CXCR5 expression. Data are shown for healthy individuals, untreated patients with rheumatoid arthritis and patients treated with corticoid and/or non-steroidal anti-inflammatory drugs or treatment with anti-tumor necrosis factor-α therapy. The percentage of CXCR3hi and CXCR5+ B cells is shown for total B cells and the subpopulation of naive B cells. Box plots show the median values, 25th and 75th quartile and the range of values. Significant differences from controls are shown (*P < 0.05, **P < 0.005). Con, control; RA, rheumatoid arthritis; SLE, systemic lupus erythematosus.
Figure 11
Figure 11
Chemokine receptor expression and B cell migration. Peripheral blood mononuclear cells were tested in a transmigration assay. A cytometric analysis showed CXCR3 (upper row) and CXCR4 (lower row) expression on CD19+ B cells before analysis (control), after 90 min incubation in medium without chemokines (input) and after migration towards the chemokines CXCL10 (upper row) or CXCL12 (lower row) respectively (migrated).

Similar articles

Cited by

References

    1. Firestein GS. The immunopathogenesis of rheumatoid arthritis. Curr Opin Rheumatol. 1991;3:398–406. - PubMed
    1. Szekanecz Z, Kim J, Koch AE. Chemokines and chemokine receptors in rheumatoid arthritis. Semin Immunol. 2003;15:15–21. doi: 10.1016/S1044-5323(02)00124-0. - DOI - PubMed
    1. Baggiolini M, Loetscher P. Chemokines in inflammation and immunity. Immunol Today. 2000;21:418–420. doi: 10.1016/S0167-5699(00)01672-8. - DOI - PubMed
    1. Zlotnik A, Yoshie O. Chemokines: a new classification system and their role in immunity. Immunity. 2000;12:121–127. doi: 10.1016/S1074-7613(00)80165-X. - DOI - PubMed
    1. Yoshie O, Imai T, Nomiyama H. Chemokines in immunity. Adv Immunol. 2001;78:57–110. - PubMed

Publication types

MeSH terms