. 2005;6(10):R86.
doi: 10.1186/gb-2005-6-10-r86. Epub 2005 Sep 30.

A catalog of stability-associated sequence elements in 3' UTRs of yeast mRNAs

Affiliations

A catalog of stability-associated sequence elements in 3' UTRs of yeast mRNAs

Reut Shalgi et al. Genome Biol. 2005.

Abstract

Background: In recent years, intensive computational efforts have been directed towards the discovery of promoter motifs that correlate with mRNA expression profiles. Nevertheless, it is still not always possible to predict steady-state mRNA expression levels based on promoter signals alone, suggesting that other factors may be involved. Other genic regions, in particular 3' UTRs, which are known to exert regulatory effects especially through controlling RNA stability and localization, were less comprehensively investigated, and deciphering regulatory motifs within them is thus crucial.

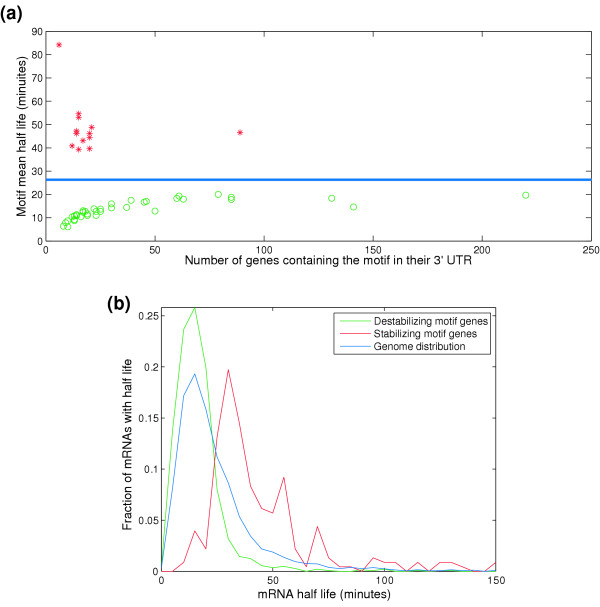
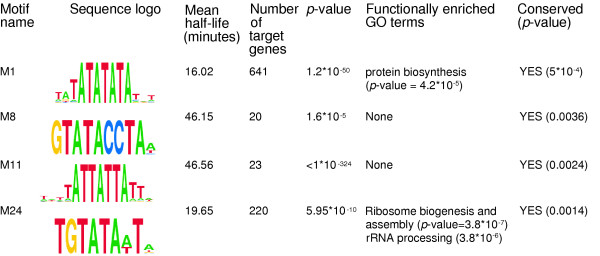
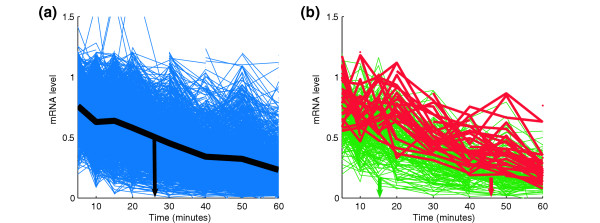
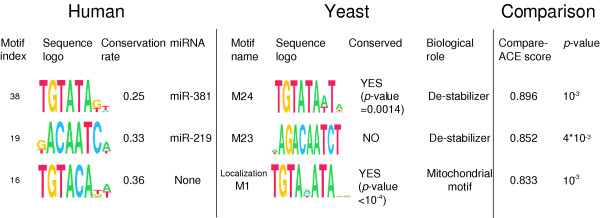
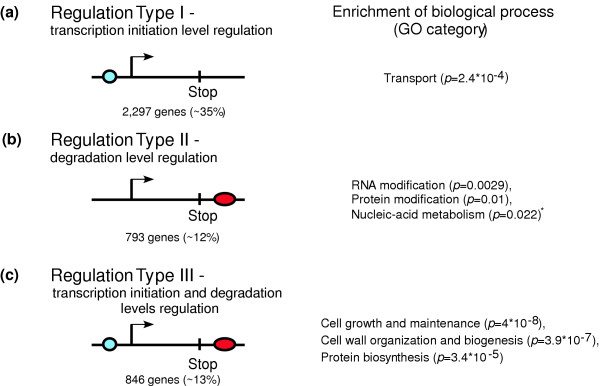
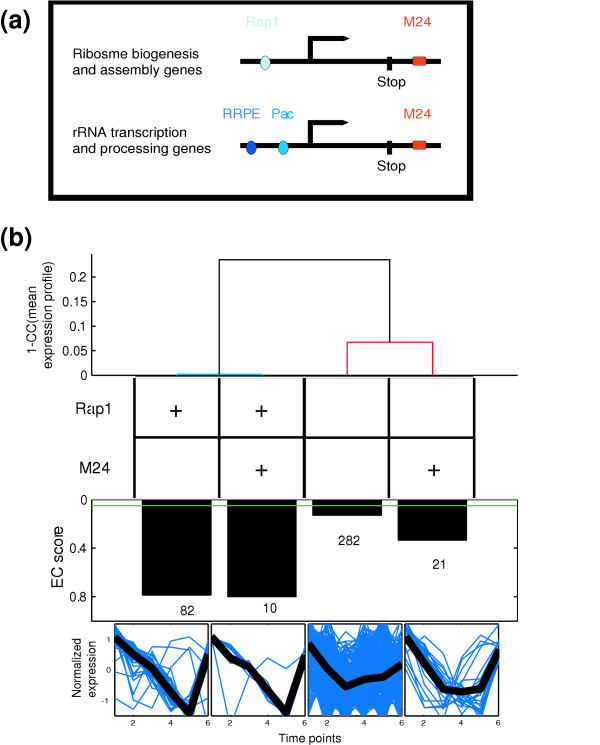
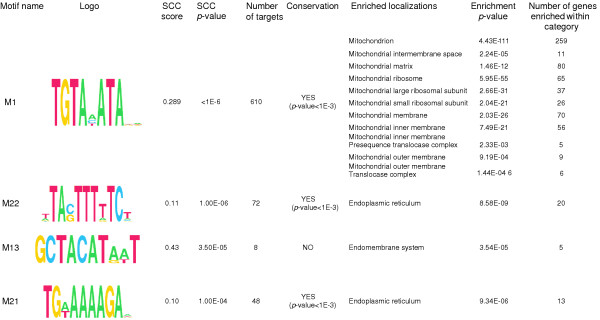
Results: By analyzing 3' UTR sequences and mRNA decay profiles of Saccharomyces cerevisiae genes, we derived a catalog of 53 sequence motifs that may be implicated in stabilization or destabilization of mRNAs. Some of the motifs correspond to known RNA-binding protein sites, and one of them may act in destabilization of ribosome biogenesis genes during stress response. In addition, we present for the first time a catalog of 23 motifs associated with subcellular localization. A significant proportion of the 3' UTR motifs is highly conserved in orthologous yeast genes, and some of the motifs are strikingly similar to recently published mammalian 3' UTR motifs. We classified all genes into those regulated only at transcription initiation level, only at degradation level, and those regulated by a combination of both. Interestingly, different biological functionalities and expression patterns correspond to such classification.

Conclusion: The present motif catalogs are a first step towards the understanding of the regulation of mRNA degradation and subcellular localization, two important processes which--together with transcription regulation--determine the cell transcriptome.


Figures

Figure 1
Figure 1
mRNA half life distributions. (a) The mean half-life versus gene target set size of 50 stabilization-associated 3' UTR motifs. The genome mean is indicated by a blue line at 26.3 mins. Each stabilizing motif is marked with a red asterisk, and each de-stabilizing motif is marked by a green circle. Motif M1, which mediates a mean half-life of 16 mins for a target set of 641 genes, is not displayed in the figure. (b) Half-life distribution of the target gene sets of all destabilizing motifs (green), of target gene sets of all stabilizing motifs (red), and of all genes (blue).
Figure 2
Figure 2
Examples of four of the 53 stability motifs discovered. M1 and M24 are destabilizing motifs, and M8 and M11 are stabilizing. Presented are mean half-life for each motif, and the p-value on the hypothesis that they mediate a significant increase or decrease in half-life compared with the genome, resulting from a ranksum test. Functional enrichment was tested as in Tavazoie et al. [5], hypergeometric p-values, and then applying FDR at q-value = 0.1. 'None' indicates that no GO term passed FDR.
Figure 3
Figure 3
Decay profiles of the entire genome and of genes regulated by a stability and a de-stability motif. (a) Decay profile of the entire genome; the black curve shows the genome average profile. (b) Decay profiles of the target gene set of the destabilizing motif M1 (green), which has a mean half-life of 16 mins, and the stabilizing motif M11 (red), which has a half-life of 46.5 mins. The mean half-lives are marked by arrows. Expression data profiles, as well as half-lives computed using a fit to an exponential function, are from Wang et al. [14].
Figure 4
Figure 4
Examples of yeast 3' UTR motifs and their best mammalian counterpart 3' UTR motif. All 72 mammalian motifs were transformed into alignments and then PSSMs, and compared with all 53 yeast motifs using CompareACE [21]. The figure presents, for the mammalian motifs by Xie et al. [11] its motif index in the original paper, the sequence logo, conservation rate, and a corresponding miRNA which is presumed to bind the motif. For the yeast motif, the motif name, sequence logo, significance of conservation across four sensu stricto yeast species, and the potential biological role are shown. The CompareACE score for similarity between the mammalian and yeast motif, along with a p-value on it, are presented on the right-hand side of the figure.
Figure 5
Figure 5
Three types of mRNA transcript regulation. (a) Type I: transcription initiation level regulation - genes that contain promoter regulatory motif(s) (blue circle) in their promoter according to Harbison et al.'s data [25], but do not contain any of the stability-associated motifs from the present analysis. (b) Type II: transcript degradation level regulation - genes that contain stability-associated motif(s) (red oval) from the present analysis but do not contain any of the promoter motifs from [25]. (c) Type III: combined transcription initiation and transcript degradation level regulation - genes that contain both promoter motif(s) and stability-associated motif(s). The figure shows the number of genes in each regulation type and the enriched biological processes that were found for them. Enrichment was calculated as a hypergeometric p-value using GO annotations.The enriched processes that were found significant after FDR (q-value = 0.1) are stated for types I and III. *In type II only borderline significance was found, (no term passed FDR) and those are reported along with their p-values.
Figure 6
Figure 6
A combined regulation of protein biosynthesis genes by promoter and 3' UTR motifs. (a) A schematic depiction of the regulation of typical ribosomal biogenesis and assembly genes and of rRNA transcription and processing genes. While many protein biosynthesis genes (predominantly ribosomal genes) are regulated by Rap1 in their promoters, and most rRNA transcription and processing genes are regulated by the combined Pac-RRPE cassette, these two types of genes are suggested here to share a stability-associated motif in their 3' UTR, namely M24. (b) Combinogram analysis [18] of the protein biosynthesis genes in the condition of environmental response to peroxide stress [61]. We gathered all genes annotated with protein biosynthesis by the SGD [32] and partitioned them into four disjoint sets: genes containing only RAP1, only M24, both of them and neither of them. The motif presence is marked by a plus symbol in the second panel. The first panel presents a dendrogram built using the correlation coefficients between the mean expression profiles of each of the four sets. We also present, for each set, its EC score [18,31], in a bar diagram. All four EC scores had a p-value < 0.05. The number of genes in each set is also given, for which we had expression profiles in the presented condition. Finally, in the fourth panel, we show the expression profiles of the genes in each set in blue, and their mean profile in black. The genes on the far right of the fourth panel, which contain only M24 in their 3' UTRs, but not Rap1 in their promoter, exhibit a significantly more coherent behavior than the background set (genes containing neither of the two motifs) and their profiles show a sharper decrease in the beginning of the experiment.
Figure 7
Figure 7
Examples of four of the 23 subcellular localization-associated motifs. Presented are motif name and logo, SCC score and p-value, number of target genes in whose 3' UTR the motif appears, and p-value for evolutionary conservation in other yeasts. Localization enrichment was computed by hypergeometric p-value, and only terms passing FDR at q-value = 0.1 are reported.

References

    1. Segal E, Shapira M, Regev A, Pe'er D, Botstein D, Koller D, Friedman N. Module networks: identifying regulatory modules and their condition-specific regulators from gene expression data. Nat Genet . 2003;34:166–176. - PubMed
    1. Bussemaker HJ, Li H, Siggia ED. Regulatory element detection using correlation with expression. Nat Genet. 2001;27:167–171. doi: 10.1038/84792. - DOI - PubMed
    1. Tompa M, Li N, Bailey TL, Church GM, De Moor B, Eskin E, Favorov AV, Frith MC, Fu Y, Kent WJ, et al. Assessing computational tools for the discovery of transcription factor binding sites. Nat Biotechnol. 2005;23:137–144. doi: 10.1038/nbt1053. - DOI - PubMed
    1. Brazma A, Jonassen I, Vilo J, Ukkonen E. Predicting gene regulatory elements in silico on a genomic scale. Genome Res. 1998;8:1202–1215. - PMC - PubMed
    1. Tavazoie S, Hughes JD, Campbell MJ, Cho RJ, Church GM. Systematic determination of genetic network architecture. Nat Genet. 1999;22:281–285. doi: 10.1038/10343. - DOI - PubMed

Publication types

MeSH terms

LinkOut - more resources