

doi: 10.1186/gb-2005-6-10-r88.
Epub 2005 Sep 19.
Searching for differentially expressed gene combinations
Affiliations
- PMID: 16207359
- PMCID: PMC1257471
- DOI: 10.1186/gb-2005-6-10-r88
Item in Clipboard
Searching for differentially expressed gene combinations
Genome Biol.
2005.
Abstract
We propose 'CorScor', a novel approach for identifying gene pairs with joint differential expression. This is defined as a situation with good phenotype discrimination in the bivariate, but not in the two marginal distributions. CorScor can be used to detect phenotype-related dependencies and interactions among genes. Our easily interpretable approach is scalable to current microarray dimensions and yields promising results on several cancer-gene-expression datasets.
Figures
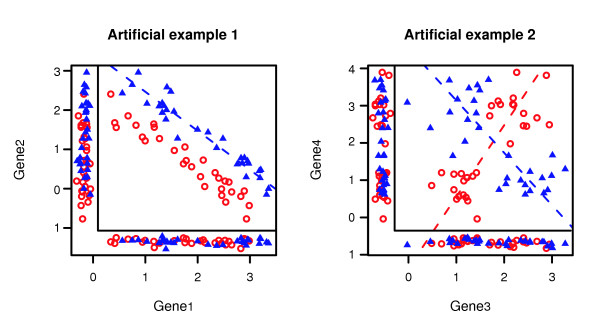
Two artificial examples of joint differential gene expression. The units of the x-axis and y-axis are gene expression; blue triangles and red circles represent samples of two different phenotypes. The inner panels reflect the joint distribution; the outer margins display the univariate marginal distributions. The dashed lines represent the first principal components, conditional on the phenotype.
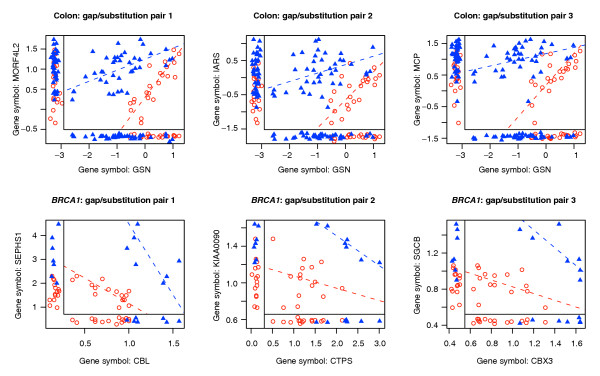
Six examples of joint differential gene expression of the gap/substitution type, obtained from the colon and BRCA1 datasets. The inner panels show the joint distribution; the outer margins display the univariate distributions. Blue triangles stand for cancers in colon and BRCA1 mutants in breast; the red circles stand for normal samples in colon and sporadic cancers in breast. The dashed lines represent the conditional first principal components.
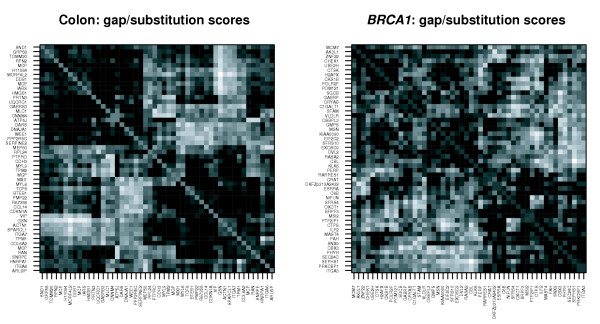
Symmetric heat map of CorScor values from Equation (1), for the colon and BRCA1 data. Columns and rows are rearranged according to a hierarchical clustering. Displayed are the 50 genes that are involved in the pairs with the highest scores. Black stands for low, grey for intermediate, and white for high score.
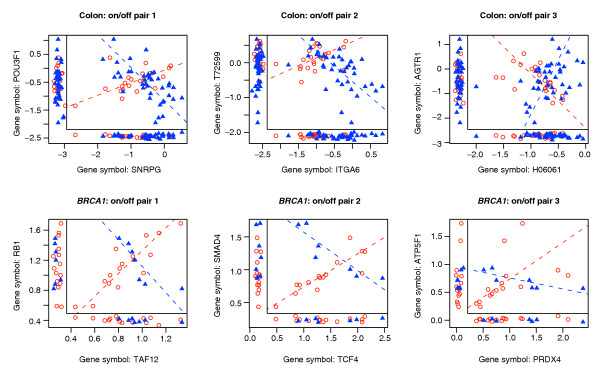
Six examples of joint differential gene expression according to the on/off-scenario, obtained from the colon and BRCA1 data. The inner panels show the joint distribution; the outer margins display the univariate distributions. Blue triangles stand for cancerous and BRCA1 mutants, the red circles for normal and BRCA1 wild types, respectively. The dashed lines represent the direction of the conditional first principal components.
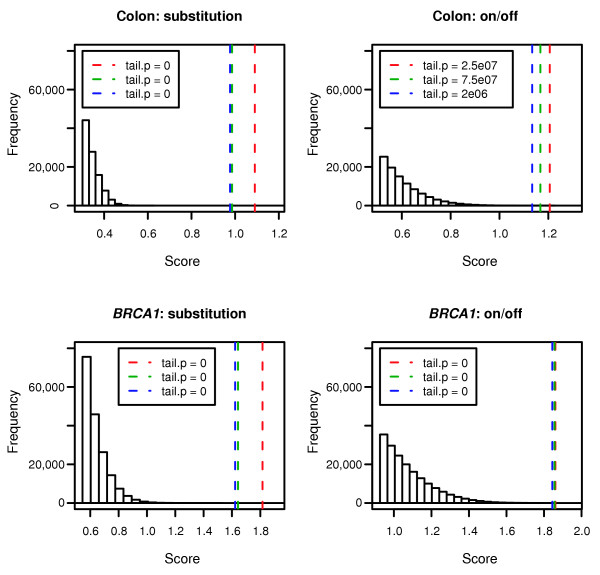
Histograms displaying the right tail of the permutation distributions of CorScor in the colon and BRCA1 data. The dashed vertical lines indicate the score values of the top three gene pairs from Figures 2 and 4. Also reported is the fraction of null scores (tail.p) that exceed each of observed values.
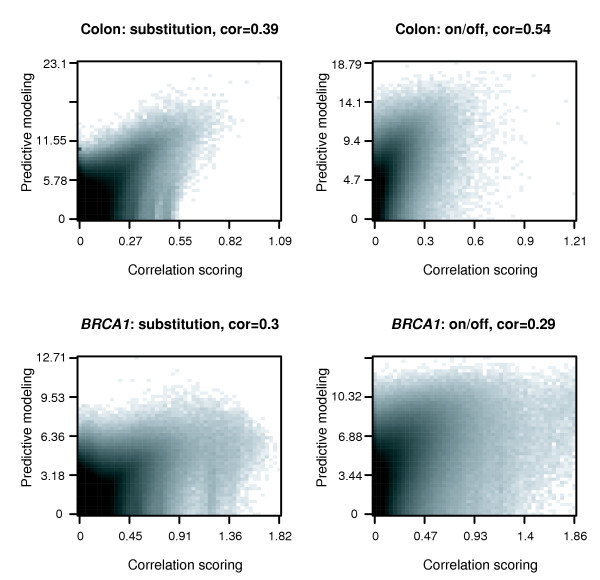
Comparison of CorScor and predictive modeling scores. Density plots for a comparison of the gap/substitution scoring function from correlation scoring defined in Equation (1) and predictive modeling (Equation (4)), as well as the on/off objective measures defined in Equations (2) and (5). Each panel is divided into a 50-×-50-cell grid. The darker the color of a cell, the more instances are therein. In the figure header, cor is the Pearson correlation coefficient between the CorScor and the respective predictive modeling scores.
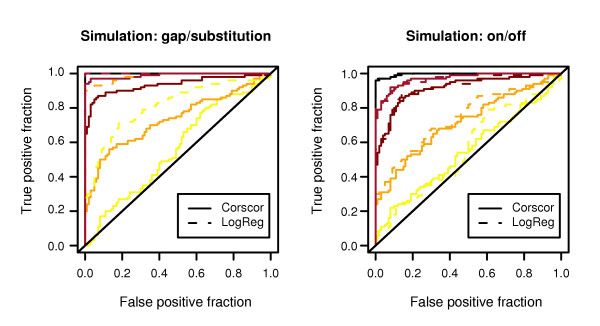
Power analysis for detecting joint differential expression. Receiver operating characteristic (ROC) curves that display the fraction of false positives, or discriminatory ability, in our simulation study to detect joint differential expression. The left panel summarizes information about the gap/substitution scenario; the right panel is about the on/off scenario. The solid lines correspond to CorScor, and the dashed ones, to logistic regression. Finally, the strength of joint differential expression was set at five different levels in our simulation experiment. The yellow lines are for the weakest amount of joint differential expression and the black lines, for the strongest amount.
References
-
- Efron B, Tibshirani R, Storey J, Tusher V. Empirical Bayes analysis of a microarray experiment. J Am Stat Assoc. 2001;96:1151–1160. doi: 10.1198/016214501753382129. - DOI
-
- Dudoit S, Fridlyand J. Classification in microarray experiments. In: Speed T, editor. Statistical Analysis of Gene Expression Data. New York: Chapman and Hall; 2003. pp. 93–158.
-
- Dettling M, Bühlmann P. Finding predictive gene groups from microarray data. J Multivariate Anal. 2004;90:106–131. doi: 10.1016/j.jmva.2004.02.012. - DOI
Publication types
MeSH terms
Grants and funding
LinkOut - more resources
Full Text Sources
