

Development of a DNA microarray for detection and identification of fungal pathogens involved in invasive mycoses
- PMID: 16207946
- PMCID: PMC1248467
- DOI: 10.1128/JCM.43.10.4943-4953.2005
Development of a DNA microarray for detection and identification of fungal pathogens involved in invasive mycoses
Abstract
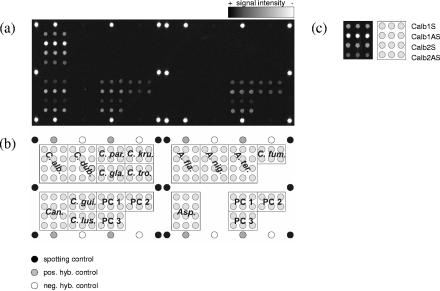
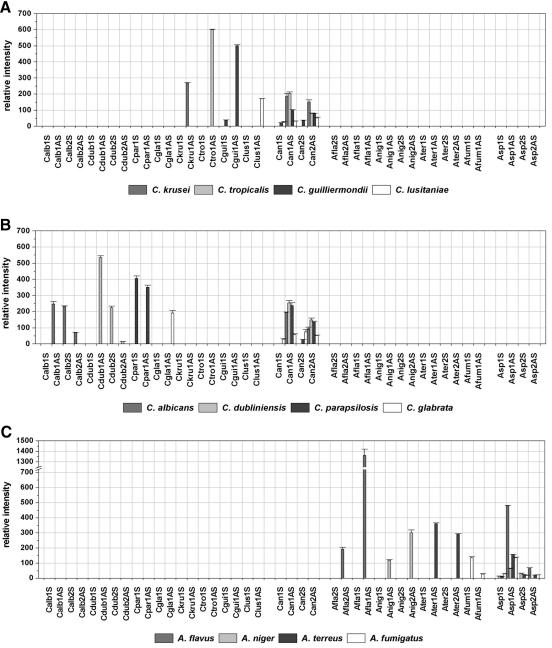
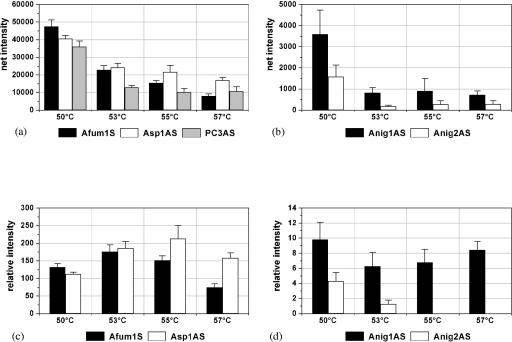
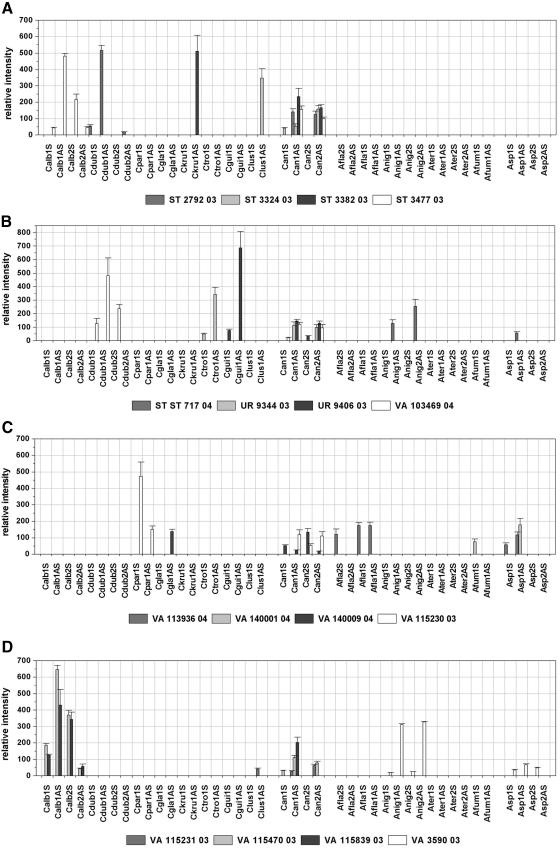
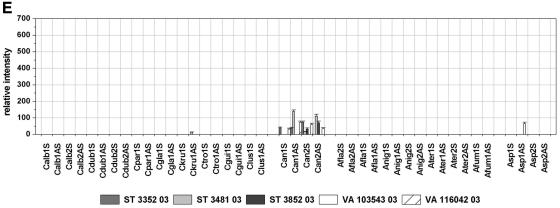
Invasive fungal infections have emerged as a major cause of morbidity and mortality in immunocompromised patients. Conventional identification of pathogenic fungi in clinical microbiology laboratories is time-consuming and, therefore, often imperfect for the early initiation of an adequate antifungal therapy. We developed a diagnostic microarray for the rapid and simultaneous identification of the 12 most common pathogenic Candida and Aspergillus species. Oligonucleotide probes were designed by exploiting the sequence variations of the internal transcribed spacer (ITS) regions of the rRNA gene cassette to identify Candida albicans, Candida dubliniensis, Candida krusei, Candida glabrata, Candida tropicalis, Candida parapsilosis, Candida guilliermondii, Candida lusitaniae, Aspergillus fumigatus, Aspergillus flavus, Aspergillus niger, and Aspergillus terreus. By using universal fungal primers (ITS 1 and ITS 4) directed toward conserved regions of the 18S and 28S rRNA genes, respectively, the fungal ITS target regions could be simultaneously amplified and fluorescently labeled. To establish the system, 12 pre-characterized fungal strains were analyzed; and the method was validated by using 21 clinical isolates as blinded samples. As the microarray was able to detect and clearly identify the fungal pathogens within 4 h after DNA extraction, this system offers an interesting potential for clinical microbiology laboratories.
Figures
References
-
- Behr, T., C. Koob, M. Schedl, A. Mehlen, H. Meier, D. Knopp, E. Frahm, U. Obst, K. H. Schleifer, R. Niessner, and W. Ludwig. 2000. A nested array of rRNA targeted probes for the detection and identification of enterococci by reverse hybridization. Syst. Appl. Microbiol. 23:563-572. - PubMed
-
- Chen, Y. C., J. D. Eisner, M. M. Kattar, S. L. Rassoulian-Barrett, K. Lafe, S. L. Yarfitz, A. P. Limaye, and B. T. Cookson. 2000. Identification of medically important yeasts using PCR-based detection of DNA sequence polymorphisms in the internal transcribed spacer 2 region of the rRNA genes. J. Clin. Microbiol. 38:2302-2310. - PMC - PubMed
Publication types
MeSH terms
Substances
Associated data
- Actions
- Actions
- Actions
- Actions
- Actions
- Actions
- Actions
- Actions
- Actions
- Actions
- Actions
- Actions
- Actions
- Actions
- Actions
- Actions
- Actions
- Actions
- Actions
- Actions
- Actions
- Actions
- Actions
- Actions
- Actions
- Actions
- Actions
- Actions
- Actions
- Actions
- Actions
- Actions
- Actions
- Actions
LinkOut - more resources
Full Text Sources
Other Literature Sources
Medical
Research Materials
