

Testosterone inhibits adipogenic differentiation in 3T3-L1 cells: nuclear translocation of androgen receptor complex with beta-catenin and T-cell factor 4 may bypass canonical Wnt signaling to down-regulate adipogenic transcription factors
- PMID: 16210377
- PMCID: PMC4417624
- DOI: 10.1210/en.2004-1649
Testosterone inhibits adipogenic differentiation in 3T3-L1 cells: nuclear translocation of androgen receptor complex with beta-catenin and T-cell factor 4 may bypass canonical Wnt signaling to down-regulate adipogenic transcription factors
Abstract
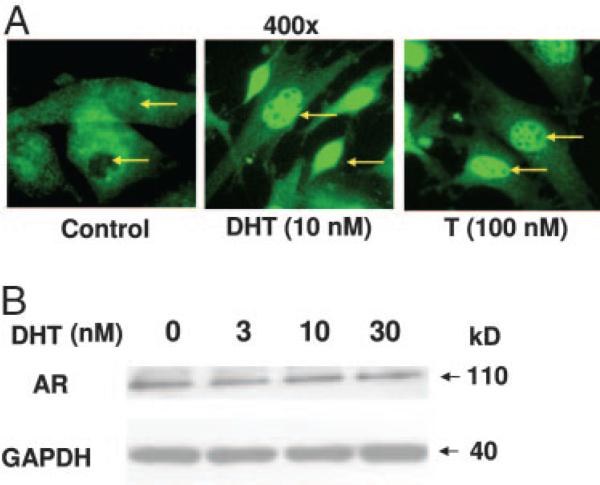
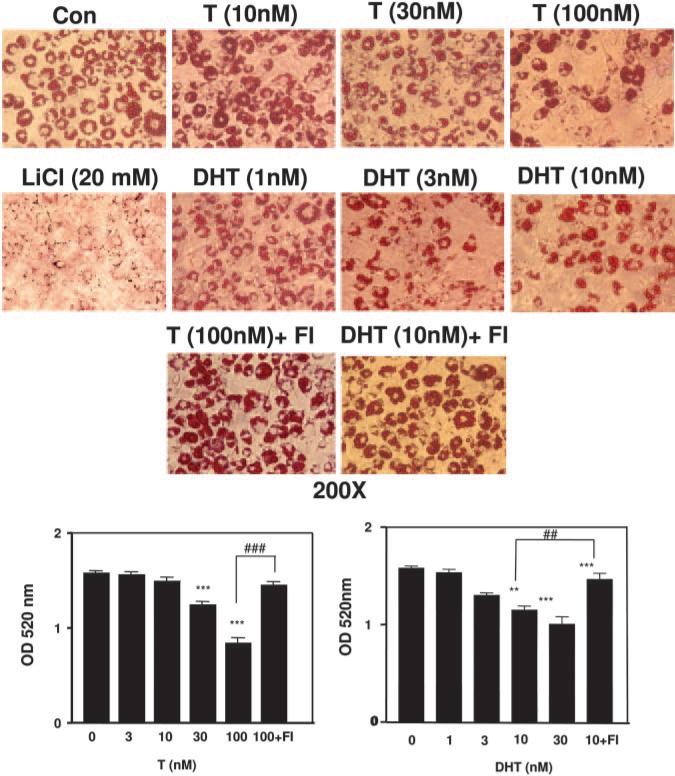
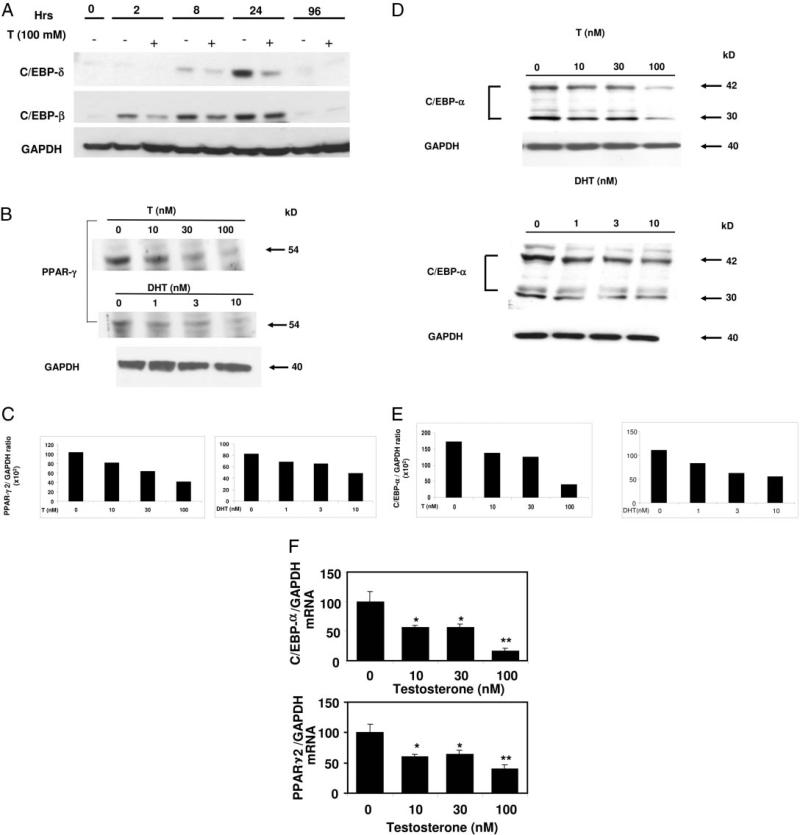
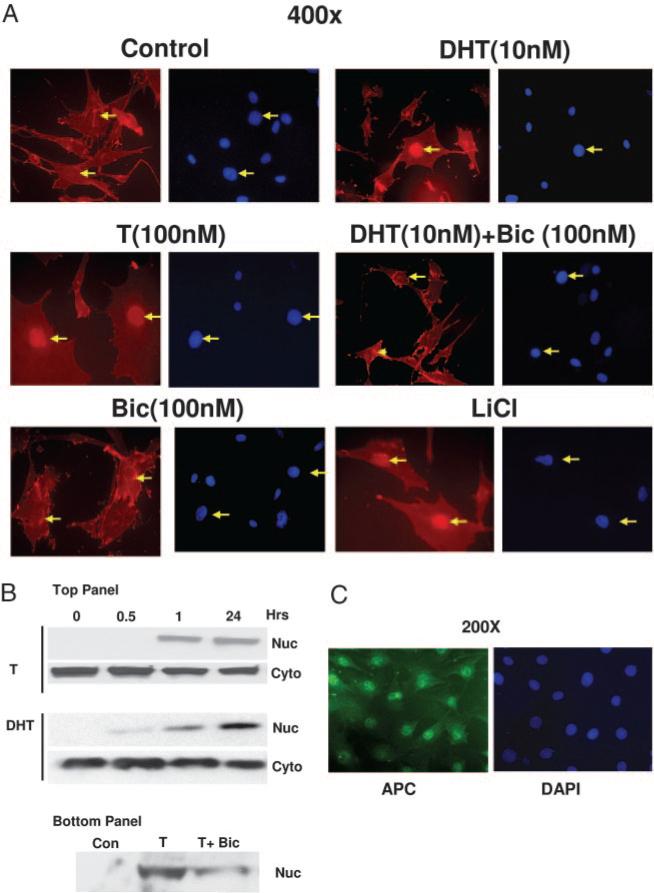
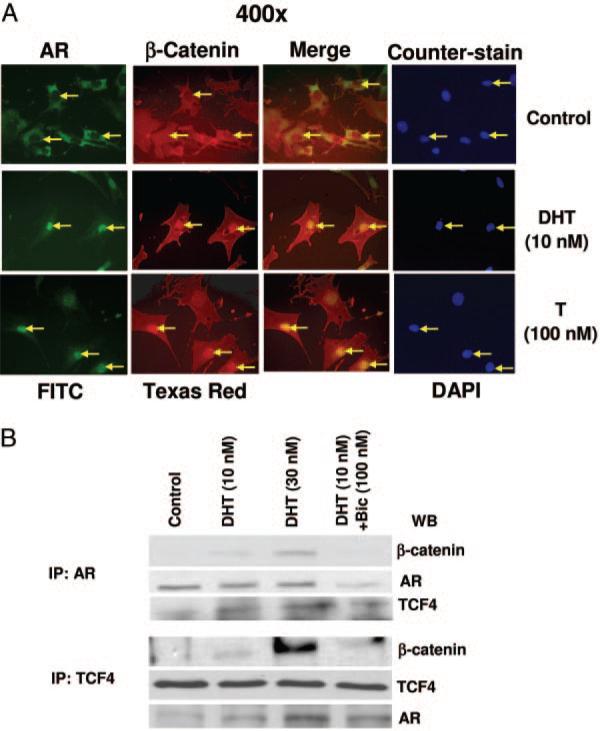
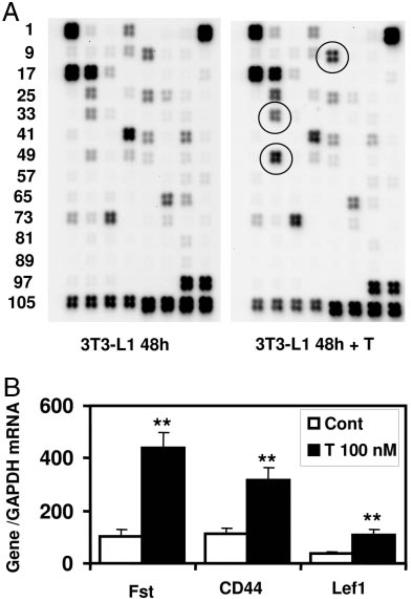
Testosterone supplementation in men decreases fat mass; however, the mechanisms by which it inhibits fat mass are unknown. We hypothesized that testosterone inhibits adipogenic differentiation of preadipocytes by activation of androgen receptor (AR)/beta-catenin interaction and subsequent translocation of this complex to the nucleus thereby bypassing canonical Wnt signaling. We tested this hypothesis in 3T3-L1 cells that differentiate to form fat cells in adipogenic medium. We found that these cells express AR and that testosterone and dihydrotestosterone dose-dependently inhibited adipogenic differentiation as analyzed by Oil Red O staining and down-regulation of CCAAT/enhancer binding protein-alpha and -delta and peroxisome proliferator-activated receptor-gamma2 protein and mRNA. These inhibitory effects of androgens were partially blocked by flutamide or bicalutamide. Androgen treatment was associated with nuclear translocation of beta-catenin and AR. Immunoprecipitation studies demonstrated association of beta-catenin with AR and T-cell factor 4 (TCF4) in the presence of androgens. Transfection of TCF4 cDNA inhibited adipogenic differentiation, whereas a dominant negative TCF4 cDNA construct induced adipogenesis and blocked testosterone's inhibitory effects. Our gene array analysis indicates that testosterone treatment led to activation of some Wnt target genes. Expression of constitutively activated AR fused with VP-16 did not inhibit the expression of CCAAT/enhancer binding protein-alpha in the absence of androgens. Testosterone and dihydrotestosterone inhibit adipocyte differentiation in vitro through an AR-mediated nuclear translocation of beta-catenin and activation of downstream Wnt signaling. These data provide evidence for a regulatory role for androgens in inhibiting adipogenic differentiation and a mechanistic explanation consistent with the observed reduction in fat mass in men treated with androgens.
Figures


Similar articles
-
Regulation of myogenic differentiation by androgens: cross talk between androgen receptor/ beta-catenin and follistatin/transforming growth factor-beta signaling pathways.Endocrinology. 2009 Mar;150(3):1259-68. doi: 10.1210/en.2008-0858. Epub 2008 Oct 23. Endocrinology. 2009. PMID: 18948405 Free PMC article.
-
Tumour necrosis factor-alpha inhibits adipogenesis via a beta-catenin/TCF4(TCF7L2)-dependent pathway.Cell Death Differ. 2007 Jul;14(7):1361-73. doi: 10.1038/sj.cdd.4402127. Epub 2007 Apr 20. Cell Death Differ. 2007. PMID: 17464333 Free PMC article.
-
The effects of myostatin on adipogenic differentiation of human bone marrow-derived mesenchymal stem cells are mediated through cross-communication between Smad3 and Wnt/beta-catenin signaling pathways.J Biol Chem. 2008 Apr 4;283(14):9136-45. doi: 10.1074/jbc.M708968200. Epub 2008 Jan 18. J Biol Chem. 2008. PMID: 18203713 Free PMC article.
-
Interaction of nuclear receptors with the Wnt/beta-catenin/Tcf signaling axis: Wnt you like to know?Endocr Rev. 2005 Dec;26(7):898-915. doi: 10.1210/er.2003-0034. Epub 2005 Aug 26. Endocr Rev. 2005. PMID: 16126938 Review.
-
Factors affecting the nuclear localization of β-catenin in normal and malignant tissue.J Cell Biochem. 2014 Aug;115(8):1351-61. doi: 10.1002/jcb.24803. J Cell Biochem. 2014. PMID: 24610469 Review.
Cited by
-
miR-26b-5p/TCF-4 Controls the Adipogenic Differentiation of Human Adipose-derived Mesenchymal Stem Cells.Cell Transplant. 2020 Jan-Dec;29:963689720934418. doi: 10.1177/0963689720934418. Cell Transplant. 2020. PMID: 32579400 Free PMC article.
-
"The Social Network" and Muscular Dystrophies: The Lesson Learnt about the Niche Environment as a Target for Therapeutic Strategies.Cells. 2020 Jul 9;9(7):1659. doi: 10.3390/cells9071659. Cells. 2020. PMID: 32660168 Free PMC article. Review.
-
Androgens inhibit adipogenesis during human adipose stem cell commitment to preadipocyte formation.Steroids. 2013 Sep;78(9):920-6. doi: 10.1016/j.steroids.2013.05.001. Epub 2013 May 23. Steroids. 2013. PMID: 23707571 Free PMC article.
-
Myocyte androgen receptors increase metabolic rate and improve body composition by reducing fat mass.Endocrinology. 2010 Jul;151(7):3125-32. doi: 10.1210/en.2010-0018. Epub 2010 Apr 28. Endocrinology. 2010. PMID: 20427479 Free PMC article.
-
The Polycystic Ovary Syndrome and the Metabolic Syndrome: A Possible Chronobiotic-Cytoprotective Adjuvant Therapy.Int J Endocrinol. 2018 Jul 25;2018:1349868. doi: 10.1155/2018/1349868. eCollection 2018. Int J Endocrinol. 2018. PMID: 30147722 Free PMC article. Review.
References
-
- Mauras N, Hayes V, Welch S, Rini A, Helgeson K, Dokler M, Veldhuis JD, Urban RJ. Testosterone deficiency in young men: marked alterations in whole body protein kinetics, strength, and adiposity. J Clin Endocrinol Metab. 1998;83:1886–1892. - PubMed
-
- Matsumoto T, Takeyama K, Sato T, Kato S. Androgen receptor functions from reverse genetic models. J Steroid Biochem Mol Biol. 2003;85:95–99. - PubMed
-
- Wilson JD. Androgen abuse by athletes. Endocr Rev. 1988;9:181–191. - PubMed
-
- Bhasin S, Woodhouse L, Casaburi R, Singh AB, Bhasin D, Berman N, Chen X, Yarasheski KE, Magliano L, Dzekov C, Dzekov J, Bross R, Phillips J, Sinha-Hikim I, Shen R, Storer TW. Testosterone dose-response relationships in healthy young men. Am J Physiol Endocrinol Metab. 2001;281:E1172–E1181. - PubMed
-
- Snyder PJ, Peachey H, Berlin JA, Hannoush P, Haddad G, Dlewati A, Santanna J, Loh L, Lenrow DA, Holmes JH, Kapoor S, Atkinson L, Strom S. Effects of testosterone replacement in hypogonadal men. J Clin Endocrinol Metab. 2000;85:2670–2677. - PubMed
Publication types
MeSH terms
Substances
Grants and funding
- S06 GM068510/GM/NIGMS NIH HHS/United States
- 1R01DK59627-01/DK/NIDDK NIH HHS/United States
- 1S06-GM068510-03/GM/NIGMS NIH HHS/United States
- U01 DK070431/DK/NIDDK NIH HHS/United States
- R01 DK070534/DK/NIDDK NIH HHS/United States
- R01 HD043348/HD/NICHD NIH HHS/United States
- U54HD041748-0/HD/NICHD NIH HHS/United States
- 1R01DK70431-01/DK/NIDDK NIH HHS/United States
- G12RR03026/RR/NCRR NIH HHS/United States
- R01 DK059627/DK/NIDDK NIH HHS/United States
- U54 HD041748/HD/NICHD NIH HHS/United States
- SC1 AG033407/AG/NIA NIH HHS/United States
- 1P20MD000545-02/MD/NIMHD NIH HHS/United States
- G12 RR003026/RR/NCRR NIH HHS/United States
- P20 MD000545/MD/NIMHD NIH HHS/United States
- 1R01HD043348-01/HD/NICHD NIH HHS/United States
LinkOut - more resources
Full Text Sources
Other Literature Sources
Research Materials
