. 2006 Feb 15;173(4):453-63.
doi: 10.1164/rccm.200412-1736OC. Epub 2005 Oct 6.

Family aggregation of upper airway soft tissue structures in normal subjects and patients with sleep apnea

Affiliations

Family aggregation of upper airway soft tissue structures in normal subjects and patients with sleep apnea

Richard J Schwab et al. Am J Respir Crit Care Med. .

Abstract

Rationale: Sleep apnea is believed to be a genetic disorder. Thus, we hypothesized that anatomic risk factors for sleep apnea would demonstrate family aggregation.

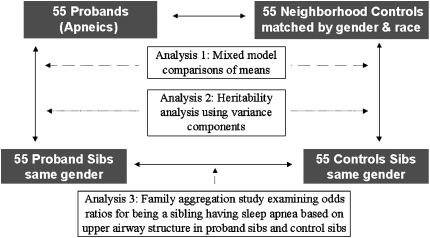
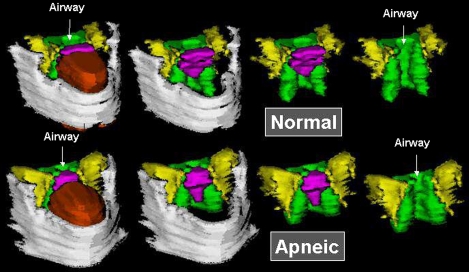
Objectives: We used volumetric magnetic resonance imaging in a sib pair "quad" design to study the family aggregation of the size of upper airway soft tissue structures that are associated with increased risk for obstructive sleep apnea.

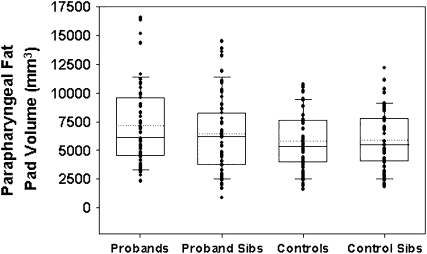
Methods: We examined 55 sleep apnea probands (apnea-hypopnea index [AHI]: 43.2 +/- 26.3 events/h), 55 proband siblings (AHI: 11.8 +/- 16.6 events/h), 55 control subjects (AHI: 2.1 +/- 1.7 events/h), and 55 control siblings (AHI: 4.2 +/- 4.0 events/h). The study design used exact matching on ethnicity and sex, frequency matching on age, and statistical control for visceral neck fat and craniofacial dimensions.

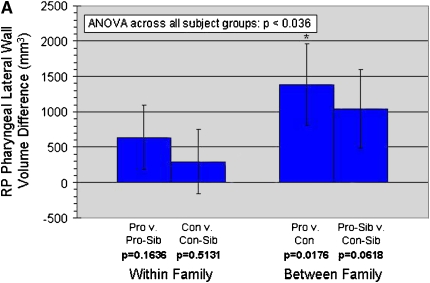
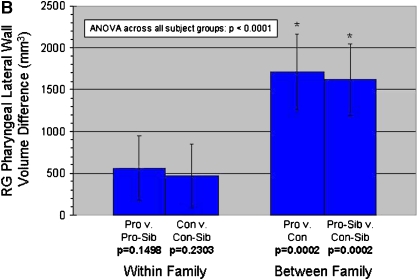
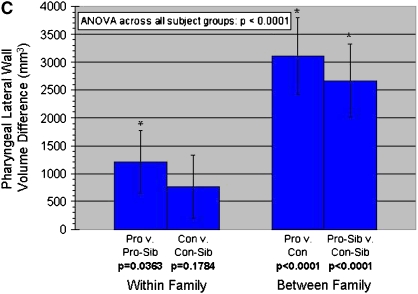
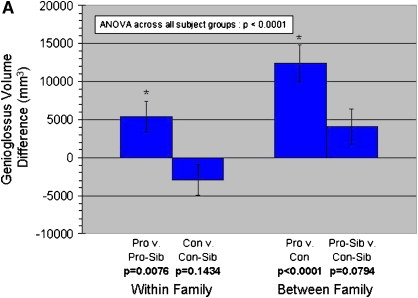
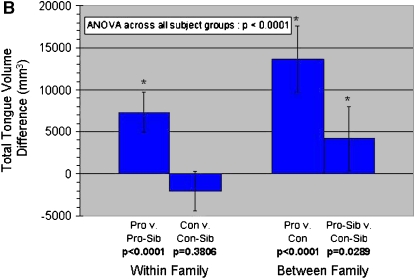
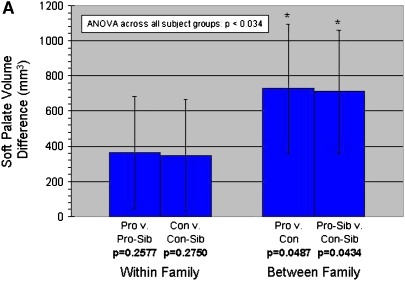
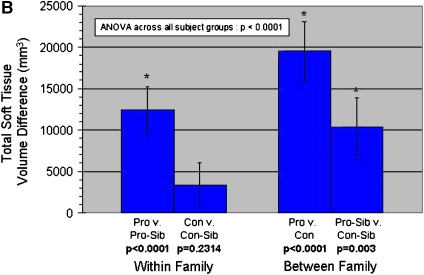
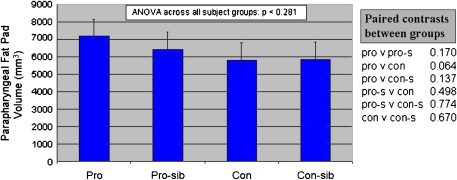
Measurements and main results: The data support our a priori hypothesis that the volume of the important upper airway soft tissue structures is heritable. The volume of the lateral pharyngeal walls (h(2) = 36.8%; p = 0.001), tongue (h(2) = 36.5%; p = 0.0001), and total soft tissue (h(2) = 37.5%; p = 0.0001) demonstrated significant levels of heritability after adjusting for sex, ethnicity, age, visceral neck fat, and craniofacial dimensions. In addition, our data indicate that heritability of the upper airway soft tissue structures is found in normal subjects and patients with apnea. Thus, it is not simply a consequence of the prevalence of apnea.

Conclusions: This is the first time family aggregation of size of the upper airway soft tissue structures has been demonstrated.


Figures

<b>Figure 1.</b>
Figure 1.
A schematic of the sib pair “quad” design with four subject groups: (1) probands (patients with obstructive sleep apnea); (2) same-sex siblings of proband within 10 yr of the age of the proband; (3) control subjects (normal subjects), matched to the proband for sex and ethnicity and had to live in the neighborhood (same school district) of the matched proband; (4) same-sex siblings of control subject within 10 yr of the age of the control subject. Family aggregation of the airway and soft tissue risk factors was assessed with three analysis strategies. The first analytic approach compared mean values across subject groups (proband, proband sibling, control subject, control sibling) taking into account the sampling by family within quad using mixed-model analyses of variance (ANOVA). The second analysis approach used an analogous mixed-model ANOVA but focused on the variance components to quantify the degree of familial aggregation (heritability) for each measurement. The third analysis approach examined odds ratios for being a sibling having sleep apnea based on upper airway structure in proband sibs and control sibs.
<b>Figure 2.</b>
Figure 2.
Volumetric reconstructions from a series of 3-mm contiguous axial magnetic resonance (MR) images of the mandible (gray), tongue (orange/rust), soft palate (pink/purple), lateral parapharyngeal fat pads (yellow), and lateral/posterior pharyngeal walls (green) in a normal subject (top panel) and in a patient with sleep apnea (bottom panel). The upper airway is larger in the normal subject than in the patient with apnea. In addition, the tongue, lateral parapharyngeal fat pads, and lateral pharyngeal walls are larger in the patient with apnea.
<b>Figure 3.</b>
Figure 3.
Comparisons of distributions of parapharyngeal fat volumes in the four subject groups. The boundary of the box closest to zero indicates the 25th percentile, a line within the box marks the median, and the boundary of the box farthest from zero indicates the 75th percentile. Whiskers above and below the box indicate the 90th and 10th percentiles. The mean is designated with a dotted line. Individual points are also plotted. There is substantial overlap in the distributions of this measurement in the four subject groups.
<b>Figure 4.</b>
Figure 4.
(A) Bar graph demonstrating that the retropalatal (RP) lateral pharyngeal wall volume is significantly different across all four subject groups: (ANOVA: p < 0.036 controlling for age, sex, race, craniofacial size, and visceral neck fat; n = 220; ± SD). Paired contrasts demonstrate that the volume of the RP lateral pharyngeal walls is significantly larger in probands (pro) compared with control subjects (con). (B) Bar graph demonstrating that the retroglossal (RG) lateral pharyngeal wall volume is significantly different across all subject groups (ANOVA: p < 0.0001 controlling for age, sex, race, craniofacial size, and visceral neck fat; n = 220; ± SD). Paired contrasts demonstrate that the volume of the RG lateral pharyngeal walls is significantly larger in probands compared with control subjects and in proband sibs compared with control sibs. (C) Bar graph demonstrating that the total lateral pharyngeal wall volume (RP and RG) is significantly different across all subject groups (ANOVA: p < 0.0001 controlling for age, sex, race, craniofacial size, and visceral neck fat; n = 220; ± SD). Paired contrasts demonstrate that the volume of the total lateral pharyngeal walls is significantly larger in probands compared with control subjects, in proband sibs compared with control sibs, and in probands compared with the proband siblings. In general, the within-family differences are significantly smaller than the between-family differences. No significant differences are noted between control subjects and control siblings for any of the measurements in AC.
<b>Figure 5.</b>
Figure 5.
(A) Bar graph demonstrating that the genioglossus volume is significantly different across all four subject groups (ANOVA: p < 0.0001 controlling for age, sex, race, craniofacial size, and visceral neck fat; n = 220; ± SD). Paired contrasts demonstrate that the volume of the genioglossus is significantly larger in probands (pro) compared with control subjects (con) and in the probands compared with the proband siblings. (B) Bar graph demonstrating that total tongue volume is significantly different across all four subject groups (ANOVA: p < 0.0001 controlling for age, sex, race, craniofacial size, and visceral neck fat; n = 220; ± SD). Paired contrasts demonstrate that the total tongue volume is significantly larger in probands compared with control subjects, in proband sibs compared with control sibs, and in the probands compared with the proband siblings. In general, larger differences are noted between families than within families and there are no significant differences between control subjects and control siblings for any of the comparisons in AB.
<b>Figure 6.</b>
Figure 6.
(A) Bar graph demonstrating that the soft palate volume is significantly different across all four subject groups (ANOVA: p < 0.034 controlling for age, sex, race, craniofacial size, and visceral neck fat; n = 220; ± SD). Paired contrasts demonstrate that the soft palate volume is significantly larger in probands (pro) compared with control subjects (con) and in the probands compared with the proband siblings. (B) Comparisons of differences in total soft tissue in all four subject groups. Bar graph demonstrating that total soft tissue volume is significantly different across all four subject groups (ANOVA: p < 0.0001 controlling for age, sex, race, craniofacial size, and visceral neck fat; n = 220; ± SD). Paired contrasts demonstrate that the total soft tissue volume is significantly larger in probands compared with control subjects, in proband sibs compared with control sibs, and in the probands compared with the proband siblings. In general, significant differences are noted between families but there are no significant differences between control subjects and control siblings for any of the comparisons in AB.
<b>Figure 7.</b>
Figure 7.
Bar graph demonstrating that the parapharyngeal fat pad volume is not significantly different across all four subject groups (ANOVA: p < 0.281 controlling for age, sex, race, and craniofacial size; n = 220; ± SD). The parapharyngeal fat pad volume is largest in the probands but the differences between subject groups are not statistically significant.

References

    1. Young T, Peppard PE, Gottlieb DJ. Epidemiology of obstructive sleep apnea: a population health perspective. Am J Respir Crit Care Med 2002;165:1217–1239. - PubMed
    1. Nieto FJ, Young TB, Lind BK, Shahar E, Samet JM, Redline S, D'Agostino RB, Newman AB, Lebowitz MD, Pickering TG. Association of sleep-disordered breathing, sleep apnea, and hypertension in a large community- based study. JAMA 2000;283:1829–1836. - PubMed
    1. Peppard PE, Young T, Palta M, Skatrud J. Prospective study of the association between sleep-disordered breathing and hypertension. N Engl J Med 2000;342:1378–1384. - PubMed
    1. Shahar E, Whitney CW, Redline S, Lee ET, Newman AB, Nieto FJ, O'Connor GT, Boland LL, Schwartz JE, Samet JM. Sleep-disordered breathing and cardiovascular disease: cross-sectional results of the Sleep Heart Health Study. Am J Respir Crit Care Med 2001;163:19–25. - PubMed
    1. Palmer LJ, Redline S. Genomic approaches to understanding obstructive sleep apnea. Respir Physiolo Neurobiol 2003;135:187–205. - PubMed

Publication types