. 2005 Nov 2;24(21):3770-80.
doi: 10.1038/sj.emboj.7600835. Epub 2005 Oct 6.

KOPS: DNA motifs that control E. coli chromosome segregation by orienting the FtsK translocase

Affiliations

KOPS: DNA motifs that control E. coli chromosome segregation by orienting the FtsK translocase

Sarah Bigot et al. EMBO J. .

Abstract

Bacterial chromosomes are organized in replichores of opposite sequence polarity. This conserved feature suggests a role in chromosome dynamics. Indeed, sequence polarity controls resolution of chromosome dimers in Escherichia coli. Chromosome dimers form by homologous recombination between sister chromosomes. They are resolved by the combined action of two tyrosine recombinases, XerC and XerD, acting at a specific chromosomal site, dif, and a DNA translocase, FtsK, which is anchored at the division septum and sorts chromosomal DNA to daughter cells. Evidences suggest that DNA motifs oriented from the replication origin towards dif provide FtsK with the necessary information to faithfully distribute chromosomal DNA to either side of the septum, thereby bringing the dif sites together at the end of this process. However, the nature of the DNA motifs acting as FtsK orienting polar sequences (KOPS) was unknown. Using genetics, bioinformatics and biochemistry, we have identified a family of DNA motifs in the E. coli chromosome with KOPS activity.


Figures

Figure 1
Figure 1
Localization of sequences controlling dimer resolution. (A) Strategy used for strain construction. Strain FC53 (top line) carries a 58 bp dif deletion and a tetracycline resistance determinant (Tc) inserted at position zdd355 (Materials and methods). Relevant chromosome fragments, indicated by black circles and black diamonds,, were cloned on each side of the psi site into a transgenesis vector and the resulting constructs were installed on the chromosome, screening for tetracycline-sensitive clones at the end of the procedure (Materials and methods). The resulting strains carry the psi site in place of a deleted fragment at the zdd355 edge of the dif-zdd355 fragment (bottom line). Deleted fragments are shown as dotted lines in parentheses. (B) Line 1 shows a map of the dif-zdd355 region. The arrows represent genes and the black and white square the indicated recombination site, dif or psi. Coordinates are in bp from the dif position. The fragments inferred to have CDR-inhibiting activity from these experiments are shown as black bars on the last line and named fragments I and II. Line 2: dif has been replaced by the psi site (redrawn from Capiaux et al, 2002). Line 3: dif has been deleted and psi inserted at the zdd355 position. Lines 4–14: psi has been inserted in place of the deletions of the indicated fragments. Deleted fragments are shown as dotted lines in parentheses. CDR activities of the strains carrying the different constructs are given on the left expressed in % of full resolution activity (100% in a wild-type strain and 0% in a dif-deleted strain) with standard deviations. They were measured using the coculture assay (Materials and methods). Each point is the mean of three independent experiments except for lines 9 and 10 for which the mean of five experiments is reported.
Figure 2
Figure 2
(A) Distribution of the candidate motifs on the chromosome. Line 1 is a map of the 58 502 bp chromosome region between positions zdc310 and zdd370 in which inversions decrease the efficiency of CDR (Perals et al, 2000; Lesterlin et al, 2005). Coordinates are in kb. The positions of the end points of previously reported inversions (the zdc, zdd and sp17 positions) are shown together with the positions of dif and its closest replication terminator, TerC. Line 2 indicates the position of the two CDR-inhibiting fragments inferred from the experiment reported in Figure 1 (fragments I and II shown as black bars). Line 3 shows the fragments that inhibit dif activity when inverted (the A, B, C and D open bars; redrawn from Perals et al, 2000; lesterlin et al, 2005). Lines 4 and 5: distribution of the indicated motifs on the top (above the lines, 5′ to 3′ left to right) and bottom (below the lines, 5′ to 3′ right to left) strand. (B) Distribution of the GGGNAGGG motif on the entire chromosome. The positions of the replication origin, oriC, and dif are indicated. Each vertical bar represents a GGGNAGGG motif on the top (upper bar) or on the bottom (lower bar) strand.
Figure 3
Figure 3
Effect of GGGNAGGG motifs on FtsK-dependent Xer recombination. (A) System used. The black and white square represents dif and the arrowhead a GGGNAGGG motif (np: nonpermissive orientation; p: permissive orientation). The star indicates the labelled extremity (the 5′ end of the strand cleaved by XerC on the short substrate). Sb and Pd indicate the two forms detected on the gels and used for quantification (substrate and product, respectively). Exchange of a first pair of strands is catalysed by XerD in the presence of XerC and FtsK50C and leads to a Holliday junction-containing intermediate. Exchange of the second pair of strands is catalysed by XerC and does not require FtsK. (B) Effect of the indicated motifs on recombination. The form corresponding to the two bands is drawn on the left (Sb and Pd). p: permissive orientation of the motif; np: nonpermissive orientation. The percentage of recombinant product (ratio of Pd DNA over total DNA (Sb+Pd)) is given below each lane (%rec, mean of three independent experiments with standard deviation (±)). Below each panel, RATIO indicates the ratio of the %rec obtained in permissive (p) and nonpermissive (np) orientation (mean of the ratios calculated for each independent experiment). Panel 1: the motif inserted is the 30 bp sequence shown in Table I, line 1. Panels 2–6: the sequences of the inserted motifs are shown. Panel 2: one GGGCAGGG motif. Panel 3: two GGGCAGGG motifs separated by 6 bp. Panel 4: three overlapping motifs. Panel 5: shuffled sequence. Panel 6: three overlapping GGGCTGGG motifs.
Figure 4
Figure 4
GGGNAGGG motifs inhibit dissociation of branched DNA structures by FtsK in a specific orientation. (A) Schematic representing the T-shaped substrate used (see Materials and methods). Distances in bp are indicated. The two 51- and 55-mer oligonucleotides with 20 bp noncomplementary extremities are shown in bold. These are ligated with a 260 bp DNA fragment allowing the loading of FtsK50C. The 40-mer oligonucleotide complementary to the forked structure is labelled (*). The concatenated arrowheads indicate the position of the three overlapping GGGCAGGG motifs (same as in Figure 3, panel 4) inserted in permissive and nonpermissive orientation. (B) Kinetics of T-shaped substrate dissociation by FtsK. Control lanes with no FtsK are shown on the left of each gel. The forms corresponding to the two bands are shown on the right. (C) Quantitative analysis of the amount of dissociated oligonucleotide due to FtsK50C activity. The amount of displaced oligonucleotide in the presence of FtsK50C was corrected by subtracting the percentage of displacement obtained in the absence of FtsK50C after 5 min. The value obtained was used to calculate the percentage of FtsK50C-dependent displacement (% displaced label strand axis) and plotted as a function of time.
Figure 5
Figure 5
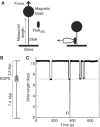
GGGNAGGG motifs block FtsK translocation at the single molecule level. (A) Schematic representation of the measurement apparatus and of the decrease of DNA extension due to loop formation by FtsK50C (see Materials and methods). (B) Schematic of the 10.5 kb DNA substrate used, with position and orientation of the three overlapping GGGCAGGG motifs (the three concatenated arrowheads) shown. Distances in kbp are indicated. (C) Typical translocation events on the DNA substrate shown in panel B. The experiment was carried out at 5 mM ATP, pulling on the bead at 1 pN. The position of the bead, expressed in kbp equivalent, is plotted as a function of time. Data quoted in units of base pairs have been corrected for the difference between the measured DNA extension and the true contour length by applying the worm-like chain model for DNA elasticity (Bouchiat et al, 1999). The dotted line indicates the position of the motifs. Fl: an example of full-length translocation event.

Similar articles

Cited by

References

    1. Aussel L, Barre FX, Aroyo M, Stasiak A, Stasiak AZ, Sherratt D (2002) FtsK is a DNA motor protein that activates chromosome dimer resolution by switching the catalytic state of the XerC and XerD recombinases. Cell 108: 195–205 - PubMed
    1. Bigot S, Corre J, Louarn J, Cornet F, Barre FX (2004) FtsK activities in Xer recombination, DNA mobilization and cell division involve overlapping and separate domains of the protein. Mol Microbiol 54: 876–886 - PubMed
    1. Blattner FR, Plunkett G III, Bloch CA, Perna NT, Burland V, Riley M, Collado-Vides J, Glasner JD, Rode CK, Mayhew GF, Gregor J, Davis NW, Kirkpatrick HA, Goeden MA, Rose DJ, Mau B, Shao Y (1997) The complete genome sequence of Escherichia coli K-12. Science 277: 1453–1474 - PubMed
    1. Bouchiat C, Wang MD, Allemand J, Strick T, Block SM, Croquette V (1999) Estimating the persistence length of a worm-like chain molecule from force–extension measurements. Biophys J 76: 409–413 - PMC - PubMed
    1. Capiaux H, Lesterlin C, Perals K, Louarn JM, Cornet F (2002) A dual role for the FtsK protein in Escherichia coli chromosome segregation. EMBO Rep 3: 532–536 - PMC - PubMed

Publication types

MeSH terms

LinkOut - more resources