

DNA barcoding Australia's fish species
- PMID: 16214743
- PMCID: PMC1609232
- DOI: 10.1098/rstb.2005.1716
DNA barcoding Australia's fish species
Abstract
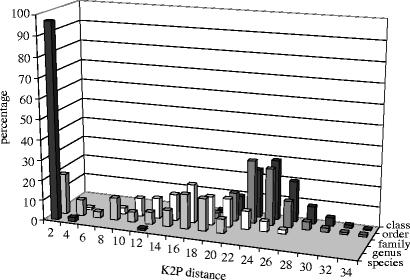
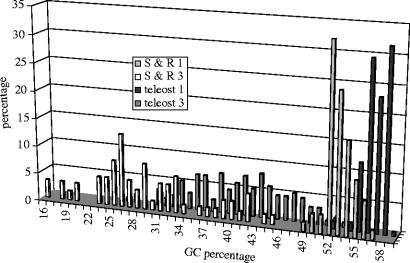
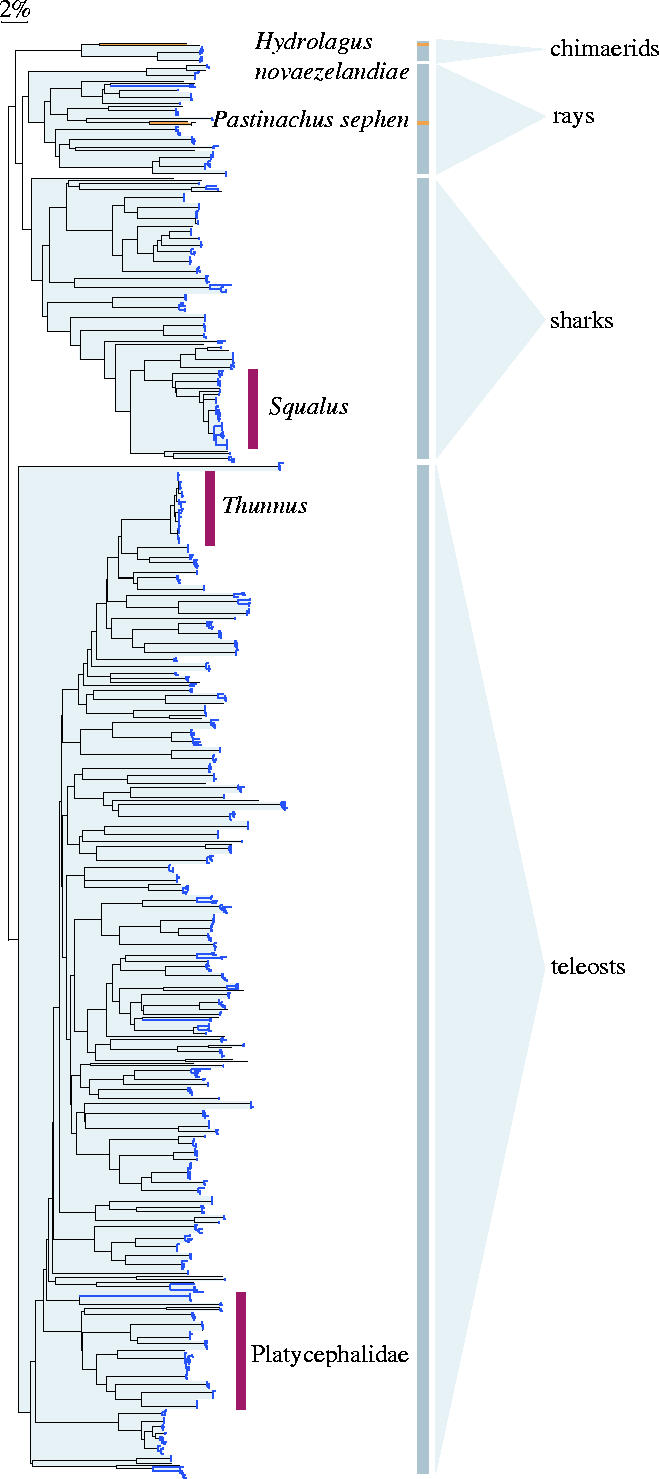
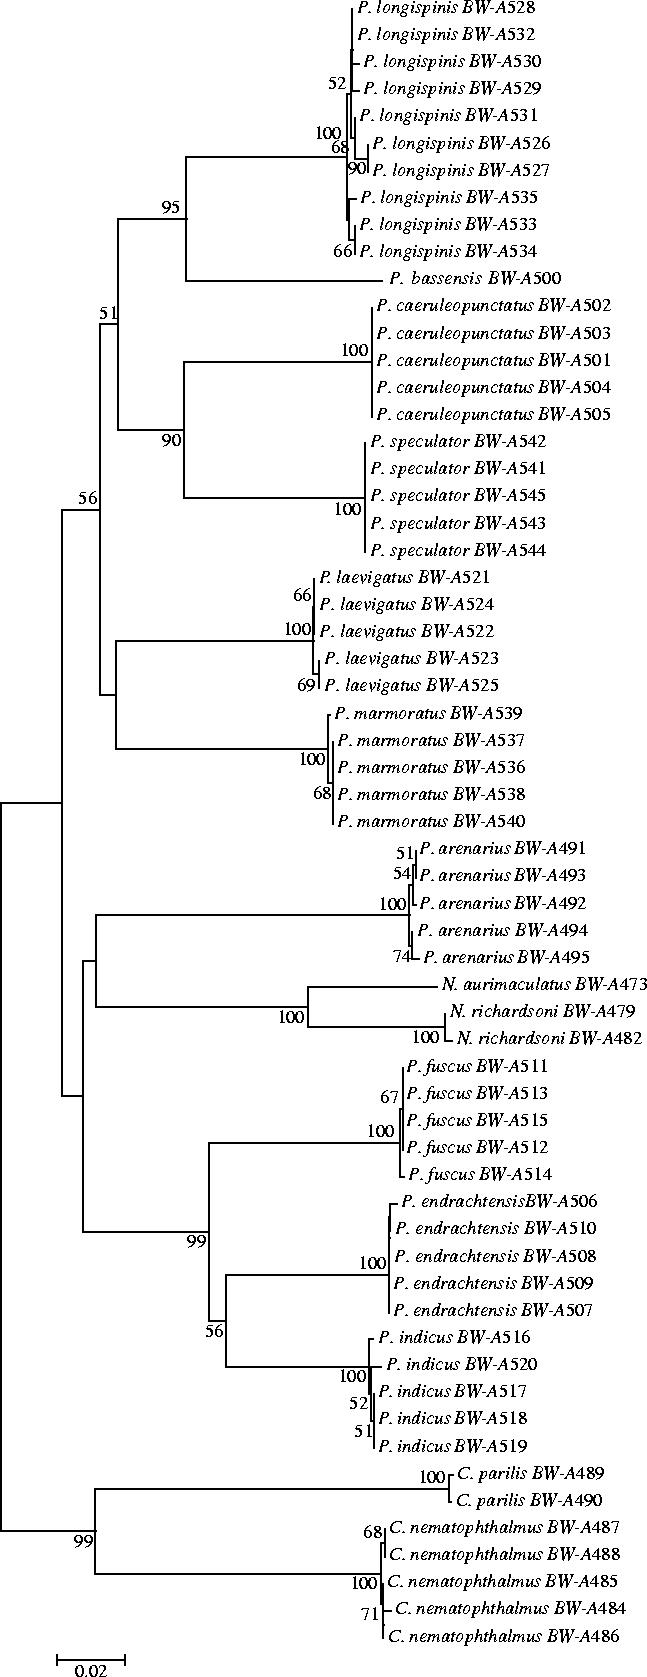
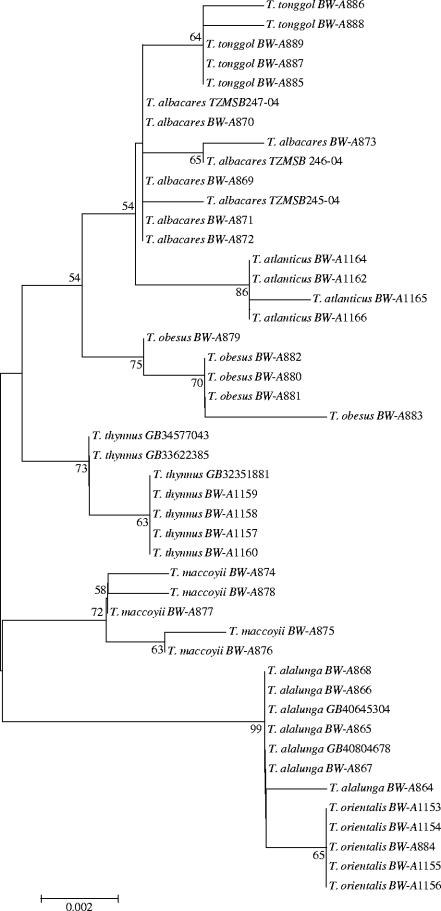
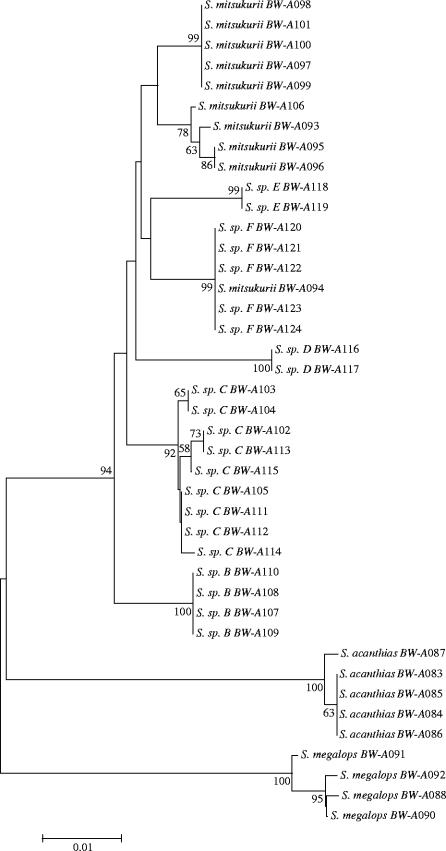
Two hundred and seven species of fish, mostly Australian marine fish, were sequenced (barcoded) for a 655 bp region of the mitochondrial cytochrome oxidase subunit I gene (cox1). Most species were represented by multiple specimens, and 754 sequences were generated. The GC content of the 143 species of teleosts was higher than the 61 species of sharks and rays (47.1% versus 42.2%), largely due to a higher GC content of codon position 3 in the former (41.1% versus 29.9%). Rays had higher GC than sharks (44.7% versus 41.0%), again largely due to higher GC in the 3rd codon position in the former (36.3% versus 26.8%). Average within-species, genus, family, order and class Kimura two parameter (K2P) distances were 0.39%, 9.93%, 15.46%, 22.18% and 23.27%, respectively. All species could be differentiated by their cox1 sequence, although single individuals of each of two species had haplotypes characteristic of a congener. Although DNA barcoding aims to develop species identification systems, some phylogenetic signal was apparent in the data. In the neighbour-joining tree for all 754 sequences, four major clusters were apparent: chimaerids, rays, sharks and teleosts. Species within genera invariably clustered, and generally so did genera within families. Three taxonomic groups-dogfishes of the genus Squalus, flatheads of the family Platycephalidae, and tunas of the genus Thunnus-were examined more closely. The clades revealed after bootstrapping generally corresponded well with expectations. Individuals from operational taxonomic units designated as Squalus species B through F formed individual clades, supporting morphological evidence for each of these being separate species. We conclude that cox1 sequencing, or 'barcoding', can be used to identify fish species.
Figures
References
-
- Alvarado Bremer J.R, Naseri I, Ely B. Orthodox and unorthodox phylogenetics relationships among tunas revealed by the nucleotide sequence analysis of the mitochondrial DNA control region. J. Fish Biol. 1997;50:540–554.
-
- Avise J.C. Chapman & Hall; New York: 1994. Molecular markers, natural history and evolution.
-
- Bensasson D, Zhang D-X, Hartl D.L, Hewitt G.M. Mitochondrial pseudogenes: evolution's misplaced witnesses. Trends Ecol. Evol. 2001;16:314–321. 10.1016/S0169-5347(01)02151-6 - DOI - PubMed
-
- Chow S, Kishino H. Phylogenetic relationships between tuna species of the genus Thunnus (Scombridae: Teleostei): inconsistent implications from morphology, nuclear and mitochondrial genomes. J. Mol. Evol. 1995;41:741–748. 10.1007/BF00173154 - DOI - PubMed
-
- Collette B.B. Adaptations and systematics of the mackerels and tunas. In: Sharp G.D, Dizon A.E, editors. The physiological ecology of tunas. Academic Press; New York: 1978. pp. 7–39.
Publication types
MeSH terms
Substances
LinkOut - more resources
Full Text Sources
Other Literature Sources
Miscellaneous