

Reverse taxonomy: an approach towards determining the diversity of meiobenthic organisms based on ribosomal RNA signature sequences
- PMID: 16214749
- PMCID: PMC1609229
- DOI: 10.1098/rstb.2005.1723
Reverse taxonomy: an approach towards determining the diversity of meiobenthic organisms based on ribosomal RNA signature sequences
Abstract
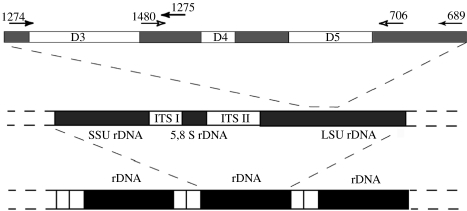
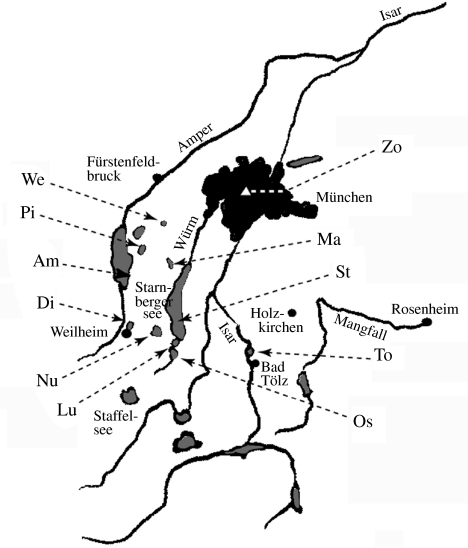
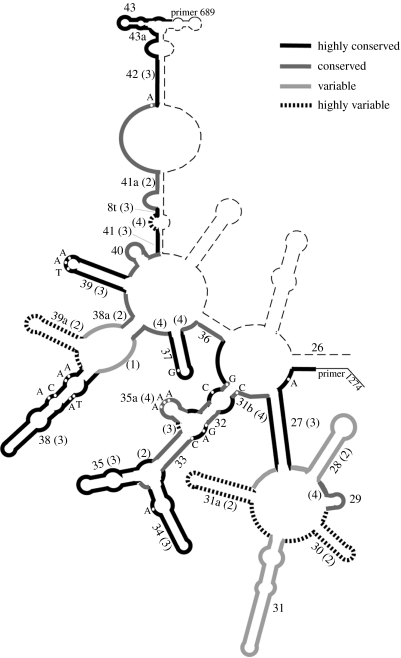
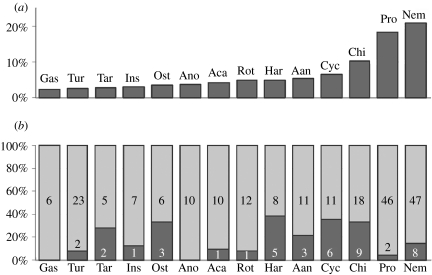
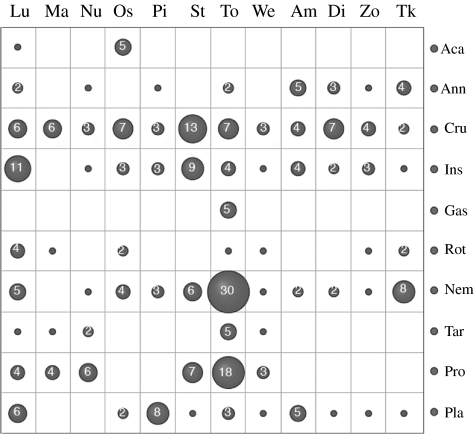
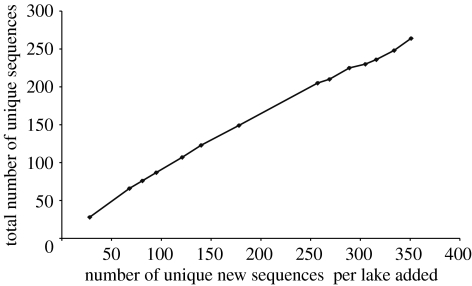
Organisms living in or on the sediment layer of water bodies constitute the benthos fauna, which is known to harbour a large number of species of diverse taxonomic groups. The benthos plays a significant role in the nutrient cycle and it is, therefore, of high ecological relevance. Here, we have explored a DNA-taxonomic approach to access the meiobenthic organismic diversity, by focusing on obtaining signature sequences from a part of the large ribosomal subunit rRNA (28S), the D3-D5 region. To obtain a broad representation of taxa, benthos samples were taken from 12 lakes in Germany, representing different ecological conditions. In a first approach, we have extracted whole DNA from these samples, amplified the respective fragment by PCR, cloned the fragments and sequenced individual clones. However, we found a relatively large number of recombinant clones that must be considered PCR artefacts. In a second approach we have, therefore, directly sequenced PCR fragments that were obtained from DNA extracts of randomly picked individual organisms. In total, we have obtained 264 new unique sequences, which can be readily placed into taxon groups, based on phylogenetic comparison with currently available database sequences. The group with the highest taxon abundance were nematodes and protozoa, followed by chironomids. However, we find also that we have by far not exhausted the diversity of organisms in the samples. Still, our data provide a framework within which a meiobenthos DNA signature sequence database can be constructed, that will allow to develop the necessary techniques for studying taxon diversity in the context of ecological analysis. Since many taxa in our analysis are initially only identified via their signature sequences, but not yet their morphology, we propose to call this approach 'reverse taxonomy'.
Figures
Similar articles
-
An integrated approach to fast and informative morphological vouchering of nematodes for applications in molecular barcoding.Philos Trans R Soc Lond B Biol Sci. 2005 Oct 29;360(1462):1945-58. doi: 10.1098/rstb.2005.1726. Philos Trans R Soc Lond B Biol Sci. 2005. PMID: 16214752 Free PMC article.
-
Defining operational taxonomic units using DNA barcode data.Philos Trans R Soc Lond B Biol Sci. 2005 Oct 29;360(1462):1935-43. doi: 10.1098/rstb.2005.1725. Philos Trans R Soc Lond B Biol Sci. 2005. PMID: 16214751 Free PMC article.
-
Molecular analyses of microbial diversity associated with the Lonar soda lake in India: an impact crater in a basalt area.Res Microbiol. 2006 Dec;157(10):928-37. doi: 10.1016/j.resmic.2006.08.005. Epub 2006 Oct 9. Res Microbiol. 2006. PMID: 17070674
-
Assessing macroinvertebrate biodiversity in freshwater ecosystems: advances and challenges in DNA-based approaches.Q Rev Biol. 2010 Sep;85(3):319-40. doi: 10.1086/655118. Q Rev Biol. 2010. PMID: 20919633 Review.
-
Microcoding: the second step in DNA barcoding.Philos Trans R Soc Lond B Biol Sci. 2005 Oct 29;360(1462):1897-903. doi: 10.1098/rstb.2005.1721. Philos Trans R Soc Lond B Biol Sci. 2005. PMID: 16214747 Free PMC article. Review.
Cited by
-
A DNA barcode library for Korean Chironomidae (Insecta: Diptera) and indexes for defining barcode gap.Mol Cells. 2012 Jan;33(1):9-17. doi: 10.1007/s10059-012-2151-2. Epub 2011 Dec 1. Mol Cells. 2012. PMID: 22138764 Free PMC article.
-
An evaluation of LSU rDNA D1-D2 sequences for their use in species identification.Front Zool. 2007 Feb 16;4:6. doi: 10.1186/1742-9994-4-6. Front Zool. 2007. PMID: 17306026 Free PMC article.
-
TaxI: a software tool for DNA barcoding using distance methods.Philos Trans R Soc Lond B Biol Sci. 2005 Oct 29;360(1462):1975-80. doi: 10.1098/rstb.2005.1729. Philos Trans R Soc Lond B Biol Sci. 2005. PMID: 16214755 Free PMC article.
-
A reverse taxonomic approach to assess macrofaunal distribution patterns in abyssal Pacific polymetallic nodule fields.PLoS One. 2015 Feb 11;10(2):e0117790. doi: 10.1371/journal.pone.0117790. eCollection 2015. PLoS One. 2015. PMID: 25671322 Free PMC article.
-
Barcoding against a paradox? Combined molecular species delineations reveal multiple cryptic lineages in elusive meiofaunal sea slugs.BMC Evol Biol. 2012 Dec 18;12:245. doi: 10.1186/1471-2148-12-245. BMC Evol Biol. 2012. PMID: 23244441 Free PMC article.
References
-
- Blaxter M.L. The promise of a DNA taxonomy. Phil. Trans. R. Soc. B. 2004;359:669–679. 10.1098/rstb.2003.1447 - DOI - PMC - PubMed
-
- Blaxter M, Mann J, Chapman T, Thomas F, Whitton C, Floyd R, Abebe E. Defining operational taxonomic units using DNA barcode data. Phil. Trans. R. Soc. B. 2005;360:1935–1943. 10.1098/rstb.2005.1725 - DOI - PMC - PubMed
-
- Burgess R. An improved protocol for separating meiofauna from sediments using colloidal silica sols. Mar. Ecol. Prog. Ser. 2001;214:161–165.
-
- Carranza S, Giribet G, Ribera C, Baguna Riutort M. Evidence that two types of 18S rDNA coexist in the genome of Dugesia (Schmidtea) mediterranea (Platyhelminthes, Turbellaria, Tricladida) Mol. Biol. Evol. 1996;13:824–832. - PubMed
-
- Elder J.F, Jr, Turner B.J. Concerted evolution of repetitive DNA sequences in eukaryotes. Q. Rev. Biol. 1995;70:297–320. 10.1086/419073 - DOI - PubMed
Publication types
MeSH terms
Substances
LinkOut - more resources
Full Text Sources
Molecular Biology Databases
Miscellaneous
