. 2006 Jan 1;90(1):381-9.
doi: 10.1529/biophysj.105.069013. Epub 2005 Oct 7.

Quantification of calcium entry at the T-tubules and surface membrane in rat ventricular myocytes

Affiliations

Quantification of calcium entry at the T-tubules and surface membrane in rat ventricular myocytes

F Brette et al. Biophys J. .

Abstract

The action potential of cardiac ventricular myocytes is characterized by its long duration, mainly due to Ca flux through L-type Ca channels. Ca entry also serves to trigger the release of Ca from the sarcoplasmic reticulum. The aim of this study was to investigate the role of cell membrane invaginations called transverse (T)-tubules in determining Ca influx and action potential duration in cardiac ventricular myocytes. We used the whole cell patch clamp technique to record electrophysiological activity in intact rat ventricular myocytes (i.e., from the T-tubules and surface sarcolemma) and in detubulated myocytes (i.e., from the surface sarcolemma only). Action potentials were significantly shorter in detubulated cells than in control cells. In contrast, resting membrane potential and action potential amplitude were similar in control and detubulated myocytes. Experiments under voltage clamp using action potential waveforms were used to quantify Ca entry via the Ca current. Ca entry after detubulation was reduced by approximately 60%, a value similar to the decrease in action potential duration. We calculated that Ca influx at the T-tubules is 1.3 times that at the cell surface (4.9 vs. 3.8 micromol/L cytosol, respectively) during a square voltage clamp pulse. In contrast, during a cardiac action potential, Ca entry at the T-tubules is 2.2 times that at the cell surface (3.0 vs. 1.4 micromol/L cytosol, respectively). However, more Ca entry occurs per microm(2) of junctional membrane at the cell surface than in the T-tubules (in nM/microm(2): 1.43 vs. 1.06 during a cardiac action potential). This difference is unlikely to be due to a difference in the number of Ca channels/junction at each site because we estimate that the same number of Ca channels is present at cell surface and T-tubule junctions ( approximately 35). This study provides the first evidence that the T-tubules are a key site for the regulation of action potential duration in ventricular cardiac myocytes. Our data also provide the first direct measurements of T-tubular Ca influx, which are consistent with the idea that cardiac excitation-contraction coupling largely occurs at the T-tubule dyadic clefts.


Figures

FIGURE 1
FIGURE 1
Action potentials are shorter after detubulation. (A) Mean action potential obtained in 10 control (left) and 10 detubulated (right) rat ventricular myocytes. (B) The mean ratio between resting potential (RP), action potential amplitude (Amp), APD25, APD50, and APD90 in detubulated and control myocytes.
FIGURE 2
FIGURE 2
ICa during a square pulse, control AP waveform and detubulated waveform in control and detubulated myocytes. The top panel shows the voltage waveform applied to cardiac myocytes (square pulse, left; control action potential, middle; detubulated action potential, right). The middle panel shows representative example of ICa measured in the same control rat ventricular myocyte under the conditions shown directly above (cell capacitance, 210 pF). The lower panel shows representative example of ICa measured in the same detubulated rat ventricular myocyte under the conditions shown on the top panel (cell capacitance, 110 pF).
FIGURE 3
FIGURE 3
ICa characteristics during square pulse, control AP waveform, and detubulated waveform in control and detubulated myocytes. (A) Mean (± SE) ICa density in control (solid bars) and detubulated (open bars) rat ventricular myocytes during square pulse (Square, left), control AP waveform (AP Ctl, middle), and detubulated AP waveform (AP Det, right). (B) Mean (± SE) time to peak ICa in control (solid bars) and detubulated (open bars) rat ventricular myocytes during square pulse (Square, left), control AP waveform (AP Ctl, middle), and detubulated AP waveform (AP Det, right). (C) Mean (± SE) time to decline to 37% of peak ICa (T0.37) in control (solid bars) and detubulated (open bars) rat ventricular myocytes during square pulse (Square, left), control AP waveform (AP Ctl, middle), and detubulated AP waveform (AP Det, right). Data are from 12 control and 13 detubulated myocytes. *P < 0.05 between cell types, #P < 0.05 versus square pulse, and P < 0.05 versus AP Ctl.
FIGURE 4
FIGURE 4
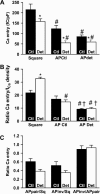
Ca entry during ICa is smaller after detubulation. (A) Mean (± SE) Ca entry during ICa in control (solid bars) and detubulated (open bars) rat ventricular myocytes during square pulse (Square, left), control AP waveform (AP Ctl, middle), and detubulated AP waveform (AP Det, right). (B) Ratio Ca entry/peak ICa for control (solid bars) and detubulated (open bars) rat ventricular myocytes during square pulse (Square, left), control AP waveform (AP Ctl, middle), and detubulated AP waveform (AP Det, right). (C) Mean (± SE) ratio for control (solid bars) and detubulated (open bars) myocytes when cells are stimulated with AP of their own type (APpair) and the other type (APinv). Data are from 12 control and 13 detubulated myocytes. *P < 0.05 between cell types, #P < 0.05 versus square pulse, and P < 0.05 versus AP Ctl.
FIGURE 5
FIGURE 5
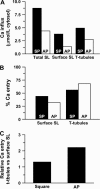
Relative distribution of Ca entry between the T-tubules and external sarcolemma. (A) Mean Ca entry during square pulse (solid bars) and AP waveform (open bars) at the total sarcolemma (Total SL, left), surface sarcolemma (Surface SL, middle), and T-tubules (right) during action potential stimulation. Ca fluxes are converted to [Ca2+] in μmol/L cytosol (see text for details). (B) The relative distribution of Ca entry during square pulse (solid bars) and AP waveform (open bars) at the surface sarcolemma (Surface SL, left) and the T-tubules (right). (C) The ratio between the Ca entry at surface sarcolemma and in the T-tubules during square pulse (Square, left) and AP waveform (AP, right).

References

    1. Wang, S. Q., L. S. Song, E. G. Lakatta, and H. Cheng. 2001. Ca2+ signalling between single L-type Ca2+ channels and ryanodine receptors in heart cells. Nature. 410:592–596. - PubMed
    1. Wier, W. G., and C. W. Balke. 1999. Ca2+ release mechanisms, Ca2+ sparks, and local control of excitation-contraction coupling in normal heart muscle. Circ. Res. 85:770–776. - PubMed
    1. Beuckelmann, D. J., and W. G. Wier. 1988. Mechanism of release of calcium from sarcoplasmic reticulum of guinea-pig cardiac cells. J. Physiol. 405:233–255. - PMC - PubMed
    1. Callewaert, G., L. Cleemann, and M. Morad. 1988. Epinephrine enhances Ca2+ current-regulated Ca2+ release and Ca2+ reuptake in rat ventricular myocytes. Proc. Natl. Acad. Sci. USA. 85:2009–2013. - PMC - PubMed
    1. Cannell, M. B., J. R. Berlin, and W. J. Lederer. 1987. Effect of membrane potential changes on the calcium transient in single rat cardiac muscle cells. Science. 238:1419–1423. - PubMed

Publication types

LinkOut - more resources