. 2006 Jan 1;90(1):340-56.
doi: 10.1529/biophysj.105.068544. Epub 2005 Oct 7.

Dipolar coupling between nitroxide spin labels: the development and application of a tether-in-a-cone model

Affiliations

Dipolar coupling between nitroxide spin labels: the development and application of a tether-in-a-cone model

Eric J Hustedt et al. Biophys J. .

Abstract

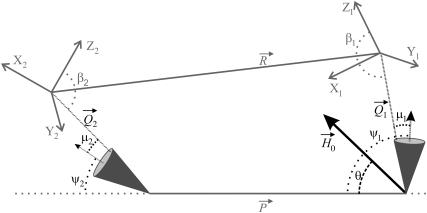
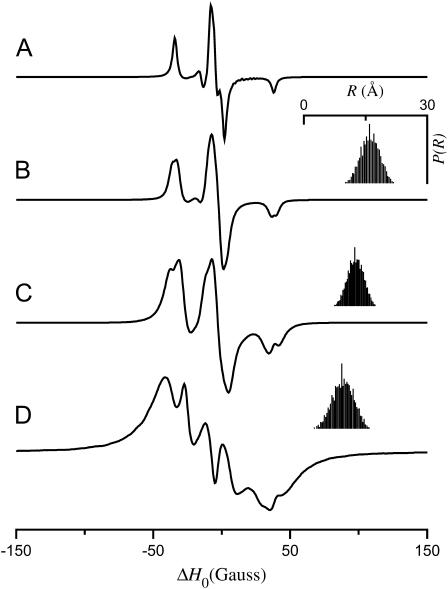
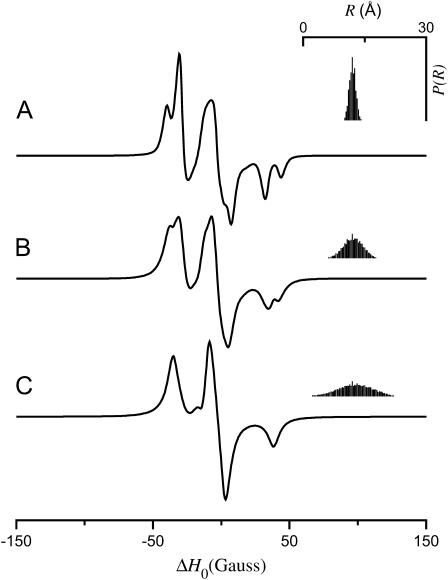
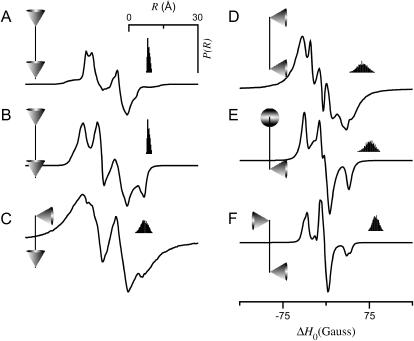
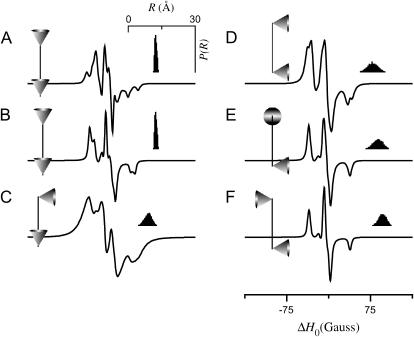
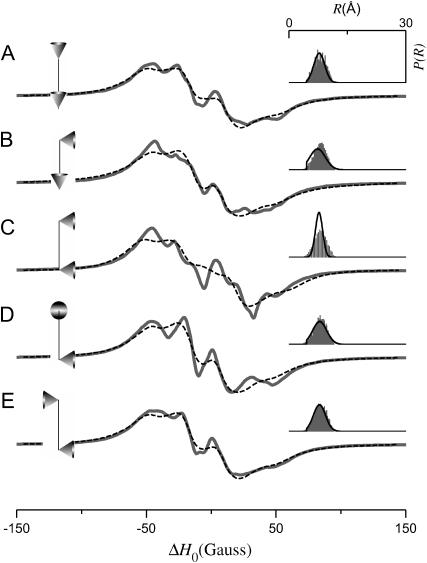
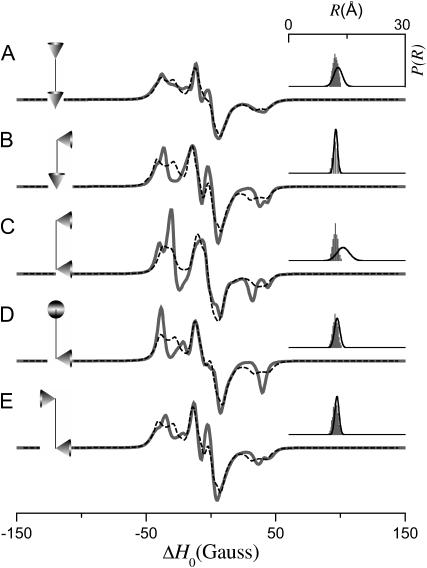
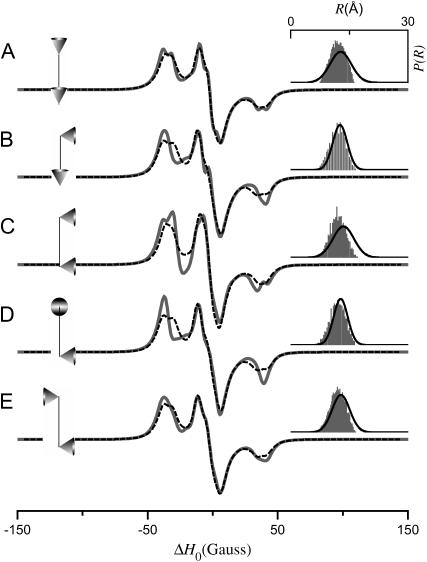
A tether-in-a-cone model is developed for the simulation of electron paramagnetic resonance spectra of dipolar coupled nitroxide spin labels attached to tethers statically disordered within cones of variable halfwidth. In this model, the nitroxides adopt a range of interprobe distances and orientations. The aim is to develop tools for determining both the distance distribution and the relative orientation of the labels from experimental spectra. Simulations demonstrate the sensitivity of electron paramagnetic resonance spectra to the orientation of the cones as a function of cone halfwidth and other parameters. For small cone halfwidths (< approximately 40 degrees ), simulated spectra are strongly dependent on the relative orientation of the cones. For larger cone halfwidths, spectra become independent of cone orientation. Tether-in-a-cone model simulations are analyzed using a convolution approach based on Fourier transforms. Spectra obtained by the Fourier convolution method more closely fit the tether-in-a-cone simulations as the halfwidth of the cone increases. The Fourier convolution method gives a reasonable estimate of the correct average distance, though the distance distribution obtained can be significantly distorted. Finally, the tether-in-a-cone model is successfully used to analyze experimental spectra from T4 lysozyme. These results demonstrate the utility of the model and highlight directions for further development.


Figures

FIGURE 1
FIGURE 1
Diagram defining parameters for the tether-in-a-cone model. The axes X, Y, and Z are the axes of the two nitroxides with X along the N-O bond and Z perpendicular to the plane of the nitroxide and with all subscripts referring to nitroxide 1 or nitroxide 2. The two cones are separated by formula imageat their bases and their relative orientation is determined by the angles ψ1, ζ2, and ψ2 (ζ2 not shown). The orientation of the two cones with respect to the magnetic field, formula image is determined by the angles θ and φ (φ not shown). The orientations of the tethers, formula imageand formula image within their respective cones are determined by the angles ν, μ, and λ (ν and λ not shown). The orientation of the tethers with respect to the nitroxide axis systems are determined by the angles α, β, and γ (α and γ not shown). Those angles that are not shown for the sake of simplicity correspond to Euler angle rotations about the appropriate Z axis as defined in Eqs. 2–8.
FIGURE 2
FIGURE 2
EPR spectra calculated for the tether-in-a-cone model as a function of p. α = β = γ = 0°, ψ1 = 90°, ζ2 = 0°, and ψ2 = 90°. (A) p = 100 Å, q = 0 Å, and μmax = 0°. For all other calculations q = 6 Å; μmax = 30°; and (B) p = 16 Å, (C) p = 12 Å, (D) p = 8 Å. For panels BD, the insets (top right) show a histogram representing the distance distribution, P(R).
FIGURE 3
FIGURE 3
EPR spectra calculated for the tether-in-a-cone model as a function of q. α = β = γ = 0°; ψ1 = 90°; ζ2 = 0°; ψ2 = 90°; p = 12 Å; μmax = 30°; and (A) q = 2 Å, (B) q = 6 Å, (C) q = 10 Å. The insets (top right) show a histogram representing P(R).
FIGURE 4
FIGURE 4
EPR spectra calculated for the tether-in-a-cone model as a function of μmax. α = β = γ = 0°; ψ1 = 90°; ζ2 = 0°; ψ2 = 90°; p = 12 Å; q = 6 Å; and (A) μmax = 10°, (B) μmax = 30°, (C) μmax = 60°. The insets (top right) show a histogram representing P(R).
FIGURE 5
FIGURE 5
EPR spectra calculated for the tether-in-a-cone model as a function of various angles. For all calculations, p = 8 Å, q = 6 Å, and μmax = 30°. (A) α = β = γ = 0° and ψ1 = ζ2 = ψ2 = 0°. (B) α = 0°, β = 90°, γ = 0°, and ψ1 = ζ2 = ψ2 = 0°. (C) α = β = γ = 0°, ψ1 = 0°, ζ2 = 0°, and ψ2 = 90°. (D) α = β = γ = 0°, ψ1 = 90°, ζ2 = 0°, and ψ2 = 90°. (E) α = β = γ = 0°, ψ1 = 90°, ζ2 = 90°, and ψ2 = 90°. (F) α = β = γ = 0°, ψ1 = 90°, ζ2 = 180°, and ψ2 = 90°. The insets (top right) show a histogram representing P(R). The diagrams to the left of each panel represent the relative orientation of the cones as determined by ψ1, ζ2, and ψ2.
FIGURE 6
FIGURE 6
EPR spectra calculated for the tether-in-a-cone model as a function of various angles. For all calculations, p = 12 Å, q = 6 Å, and μmax = 30°. (A) α = β = γ = 0° and ψ1 = ζ2 = ψ2 = 0°. (B) α = 0°, β = 90°, γ = 0°, and ψ1 = ζ2 = ψ2 = 0°. (C) α = β = γ = 0°, ψ1 = 0°, ζ2 = 0°, and ψ2 = 90°. (D) α = β = γ = 0°, ψ1 = 90°, ζ2 = 0°, and ψ2 = 90°. (E) α = β = γ = 0°, ψ1 = 90°, ζ2 = 90°, and ψ2 = 90°. (F) α = β = γ = 0°, ψ1 = 90°, ζ2 = 180°, and ψ2 = 90°. The insets (top right) show a histogram representing P(R). The diagrams to the left of each panel represent the relative orientation of the cones as determined by ψ1, ζ2, and ψ2.
FIGURE 7
FIGURE 7
EPR spectra (solid gray lines) calculated for the tether-in-a-cone model to show the effect of cone orientation for 〈R〉 ≈ 8 Å and σR ≈ 1.5 Å. The values of p, q, μmax, ψ1, ζ2, and ψ2 are given in Table 1. For all calculations, α = β = γ = 0°. The fits obtained by the Fourier convolution method are shown as dashed black lines. The diagrams to the left of each panel represent the relative orientation of the cones as determined by ψ1, ζ2, and ψ2. The insets to the right show the actual distance distribution (gray histogram) for the simulated EPR spectrum and the distance distribution (black line) obtained by the Fourier convolution method.
FIGURE 8
FIGURE 8
EPR spectra (solid gray lines) calculated for the tether-in-a-cone model to show the effect of cone orientation for 〈R〉 ≈ 12 Å and σR ≈ 0.6 Å. The values of p, q, μmax, ψ1, ζ2, and ψ2 are given in Table 1. For all calculations, α = β = γ = 0°. The fits obtained by the Fourier convolution method are shown as dashed black lines. The diagrams to the left of each panel represent the relative orientation of the cones as determined by ψ1, ζ2, and ψ2. The insets to the right show the actual distance distribution (gray histogram) for the simulated EPR spectrum and the distance distribution (black line) obtained by the Fourier convolution method.
FIGURE 9
FIGURE 9
EPR spectra (solid gray lines) calculated for the tether-in-a-cone model to show the effect of cone orientation for 〈R〉 ≈ 12 Å and σR ≈ 1.9 Å. The values of p, q, μmax, ψ1, ζ2, and ψ2 are given in Table 1. For all calculations, α = β = γ = 0°. The fits obtained by the Fourier convolution method are shown as dashed black lines. The diagrams to the left of each panel represent the relative orientation of the cones as determined by ψ1, ζ2, and ψ2. The insets to the right show the actual distance distribution (gray histogram) for the simulated EPR spectrum and the distance distribution (black line) obtained by the Fourier convolution method.
FIGURE 10
FIGURE 10
EPR spectra (solid gray lines) calculated for the tether-in-a-cone model to show the effect of cone orientation for 〈R〉 ≈ 12 Å and σR ≈ 3.4 Å. The values of p, q, μmax, ψ1, ζ2, and ψ2 are given in Table 1. For all calculations, α = β = γ = 0°. The fits obtained by the Fourier convolution method are shown as dashed black lines. The diagrams to the left of each panel represent the relative orientation of the cones as determined by ψ1, ζ2, and ψ2. The insets to the right show the actual distance distribution (gray histogram) for the simulated EPR spectrum and the distance distribution (black line) obtained by the Fourier convolution method.
FIGURE 11
FIGURE 11
Values of ℛcorr for the fits to the tether-in-a-cone model simulations using the Fourier convolution method assuming a single Gaussian distance distribution (Figs. 7–10) are plotted versus q (A), μmax (B), and σR (C).
FIGURE 12
FIGURE 12
Simulated EPR spectra (gray lines) analyzed using a Fourier convolution method assuming a bimodal Gaussian distribution. The fits obtained by the Fourier convolution method are shown as dashed lines. The insets show the actual distance distribution for the simulated EPR spectrum (gray histogram) and the distance distribution obtained by the Fourier convolution method (dashed line). (A) Same simulation as in Fig. 7 B. (B) Simulation is the sum of those in Figs. 7 B and 9 B. (C) Simulation is the sum of those in Figs. 7 B and 10 B. In the insets to panels B and C the dotted lines were obtained by fitting the histograms to a bimodal Gaussian distribution. The dotted spectra were generated by the Fourier convolution method using these bimodal Gaussian distributions.
FIGURE 13
FIGURE 13
EPR spectra of spin-labeled T4 lysozyme mutants. Shown on the left are the sum of singles spectra (T4L 61 + T4L 65, T4L 65 + T4L 68, T4L 65 + T4L 69; green lines) with the spectra of the double cysteine mutants (T4L 61/65, T4L 65/68, T4L 65/69; black lines) overlaid on an expanded (×5) scale. The spectra of the double cysteine mutants are also shown on the right (black circles) with fits obtained to the tether-in-a-cone model (blue lines) and obtained by the convolution method (red lines) overlaid. The distance distributions obtained using both methods are plotted in the insets at the top right. All spectra were obtained as described in the text with the spin-labeled T4L mutants in desalting buffer plus 70% (w/w) glycerol at −30°C. Analysis of the spectra of the four single cysteine mutants gave the following parameters (fits not shown): T4L 61, gxx = 2.00814, gyy = 2.00606, gzz = 2.00230, Axx = 6.34 Gauss, Ayy = 5.45 Gauss, Azz = 36.29 Gauss, Lorentzian linewidth Γ = 2.28 Gauss; T4L 65, gxx = 2.00821, gyy = 2.00603, gzz = 2.00226, Axx = 6.43 Gauss, Ayy = 5.54 Gauss, Azz = 36.07 Gauss, Γ = 2.31 Gauss; T4L 68, gxx = 2.00817, gyy = 2.00606, gzz = 2.00228, Axx = 6.51 Gauss, Ayy = 5.27 Gauss, Azz = 36.05 Gauss, Γ = 2.31 Gauss; T4L 69, gxx = 2.00815, gyy = 2.00602, gzz = 2.00233, Axx = 6.48 Gauss, Ayy = 5.35 Gauss, Azz = 36.01 Gauss, Γ = 2.30 Gauss. The parameters obtained by fitting the three spectra of the double cysteine mutants to the tether-in-a-cone model are given in Table 2. Fits were obtained with the following parameters fixed: q = 7.08 Å, β = 78.9°, and γ = 330.5°. Values of p were fixed as given in Table 2. The parameters obtained by fitting the spectra of the double cysteine mutants using the convolution method were: T4L 61/65, R0 = 7.51 Å and σR = 0.61 Å; T4L 65/68, R0 = 10.61 Å and σR = 5.07 Å; T4L 65/69, Amplitude1 = 1.00, (R0)1 = 7.51 Å, (σR)1 = 0.61 Å, Amplitude2 = 0.82, (R0)2 = 9.90 Å, and (σR)2 = 5.57 Å. The inset at the center of the figure is a ribbon diagram representing the structure of T4L (PDB, 3LZM (40)) with the α-carbons of residues 61 (red), 65 (green), 68 (blue), and 69 (yellow) shown as colored spheres.
FIGURE 14
FIGURE 14
Confidence intervals for ζ2 from the analysis of the spectra of the three spin-labeled double cysteine mutants of T4L using the tether-in-a-cone model. The values of χ2 were obtained by adjusting ψ1, ψ2, and μmax to obtain the best fit to the data at fixed values of ζ2. The top panel shows the results plotted fullscale. The bottom panel shows an expanded scale. In both panels, each curve is scaled to its 99% confidence level calculated using the F-statistic (dashed line). Results are shown for T4L 61/65 (▪), T4L 65/68 (•), and T4L 65/69 (▴).

Similar articles

Cited by

References

    1. Hubbell, W. L., and C. Altenbach. 1994. Investigation of structure and dynamics in membrane proteins using site-directed spin-labeling. Curr. Opin. Struct. Biol. 4:566–573.
    1. Hubbell, W. L., D. S. Cafiso, and C. Altenbach. 2000. Identifying conformational changes with site-directed spin labeling. Nat. Struct. Biol. 7:735–739. - PubMed
    1. Mchaourab, H. S., and E. Perozo. 2000. Determination of protein folds and conformational dynamics using spin-labeling EPR spectroscopy. In Biological Magnetic Resonance: Distance Measurements in Biological Systems by EPR, Vol. 19. L. J. Berliner, G. R. Eaton, and S. S. Eaton, editors. Kluwer Academic/Plenum Publishers, New York, NY. 185–247.
    1. Hustedt, E. J., and A. H. Beth. 1999. Nitroxide spin-spin interactions: applications to protein structure and dynamics. Annu. Rev. Biophys. Biomol. Struct. 28:129–153. - PubMed
    1. Columbus, L., and W. L. Hubbell. 2002. A new spin on protein dynamics. Trends Biochem. Sci. 27:288–295. - PubMed

Publication types

LinkOut - more resources